Economy
A Closer Look at What SuperTrend Indicator is and How Simple it is to Use
There is an array of tools being developed on a daily basis and it’s imperative that you stay up to date on the ones that concern you.
For intraday traders, there is always a degree of risk when buying or selling assets. However, taking well-informed risks is what makes all the difference.
Keeping up with all the factors and events that affect the stock market, however, is a tough row to hoe. To be successful as an intraday trader, you need to make use of all the tools at your disposal.
These include mathematical calculations like moving averages, Fibonacci retracement, Bollinger bands, and so on.
When it comes to intraday trading, the SuperTrend Indicator is one of the most useful tools at your disposal and can help you step up your game.
Not only does it help you follow market trends, but it also provides buy and sell signals to help you maximize your profit.
If you are an intraday trader and is looking for the perfect tool to help you level up your game, the SuperTrend Indicator is one of the best options available.
Read on to find out more about the SuperTrend Indicator and how simple it is to use.
What Is the SuperTrend Indicator?
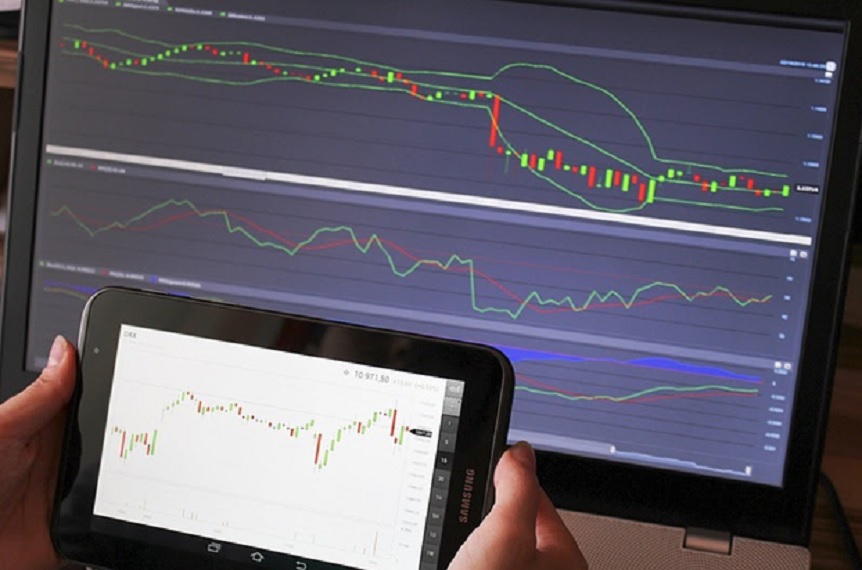
The SuperTrend Indicator is an overlay on your trading chart that helps you follow the direction of current trends. It is a very powerful yet often underutilized utility.
The trend indicator plots the price of the asset against time and through some basic computation provides a trend of the price of the asset. The chart is based on two parameters: the average true range and a multiplier.
The SuperTrend Indicator is similar to a moving average indicator and provides buy and sell signals. The data provided from this simple chart can help simplify your trading decisions.
In fact, it is the simplicity of the tool that makes it extremely popular amongst intraday traders and ideal for beginners. One thing that must be kept in mind is that the SuperTrend Indicator cannot predict trends.
It is a lagging indicator and depends on the current price action to provide signals. As such, it cannot predict the future trend of the price of the asset. What it does show is the current trend of the prices.
How Easy is it to Use the SuperTrend Indicator?
The SuperTrend Indicator is amongst the easiest indicators to understand, use and follow. It is perfect for those who are new to the world of technical analysis, who get confused while dealing with concepts like price action theory and who have trouble reading charts like candlestick charts.
Since it is based on only two parameters, it is easy to tweak to get the best possible results. The default values of the average true range and multiplier are set to 10 and 3, respectively.
There are no perfect values for these parameters and changing them alters the behaviour of the SuperTrend Indicator.
The trading pros at https://www.netpicks.com/supertrend-indicator/ indicate that any changes to the SuperTrend Indicator should be backtested before using any real money.
Reading the SuperTrend Indicator is also quite straightforward. Being an overlay, it is plotted over the closing price of the asset.
When the value of the asset falls below the closing price, the indicator turns green, indicating the opportunity to buy.
On the other hand, if the indicator rises above the closing price, the lights turn red, indicating the opportunity to sell. It doesn’t get any simpler than that.
Benefits of the SuperTrend Indicator
The SuperTrend Indicator is an excellent tool for intraday traders. Due to its popularity, it is available on most trading websites without any additional costs. A big advantage of this tool is its flexibility. It works for forex, futures, and equity, and it also allows you to set up various time frames from daily to weekly.
The indicator gives accurate signals at precise times; however, one may have to tweak the two parameters in order to minimize the error in the displayed trend.
The biggest advantage of the indicator is its simplicity. It provides all the essential information while keeping the interface minimal and easy to understand.

The SuperTrend Indicator is amongst the most straightforward and intuitive indicators that provide buy and sell signals.
However, the SuperTrend Indicator is not ideal for each and every situation and works only when the market is trading.
As such, it is best suited for the purpose of short-term technical analysis. If you are looking for a way to make better-informed decisions on intraday trades, you can’t go wrong with the SuperTrend Indicator.


By Adedapo Adesanya
The NASD Over-the-Counter (OTC) Securities Exchange extended its stay in the south territory with a decline of 0.56 per cent on Wednesday, April 2.
This brought down the market capitalisation by N13 billion to N2.417 trillion from N2.430 trillion, and downed the NASD Unlisted Security Index (NSI) by 22.57 points to 4,062.87 points from the previous session’s 4,062.87 points.
It was observed that the NASD exchange ended with three price gainers and three price losers during the trading day.
MRS Oil Plc depreciated by N19.00 to close at N171.00 per unit compared with the previous price of N190.00 per unit, NASD Plc lost N4.14 to trade at N37.36 per share compared with Wednesday’s N41.50 per share, and Central Securities Clearing System (CSCS) Plc gave up N2.00 to sell at N78.00 per unit versus N80.00 per unit.
On the flip side, FrieslandCampina Wamco Nigeria Plc appreciated by 19 Kobo to N93.00 per share from N92.81 per share, Food Concepts Plc expanded by 15 Kobo to N2.87 per unit from N2.72 per unit, and Great Nigeria Insurance (GNI) Plc improved by 2 Kobo to 52 Kobo per share from 50 Kobo per share.
Yesterday, the volume of securities dipped by 91.8 per cent to 260.2 million units from 3.2 billion units, the value of securities went down by 98.1 per cent to N154.2 million from N8.3 billion, while the number of deals soared by 53.3 per cent to 46 deals from 30 deals.
GNI Plc was the most active stock by value on a year-to-date basis with 3.4 billion units worth N8.4 billion, followed by CSCS Plc with 56.9 million units valued at N3.9 billion, and Okitipupa Plc with 27.5 million units traded for N1.8 billion.
The most traded stock by volume on a year-to-date basis was also GNI Plc with 3.4 billion units sold for N8.2 billion, trailed by Resourcery Plc with 1.1 billion units exchanged for N415.7 million, and Infrastructure Guarantee Credit Plc with 400 million units transacted for N1.2 billion.

By Adedapo Adesanya
The Naira dropped N2.09 or 0.15 per cent against the United States Dollar in the Nigerian Autonomous Foreign Exchange Market (NAFEX) on Thursday, April 2, to trade at N1,380.79/$1 compared with Wednesday’s rate of N1,378.70/$1.
However, it appreciated against the Pound Sterling in the official market by N2.77 to quote at N1,824.86/£1 versus the N1,836.57/£1 it was traded at midweek, and improved its value against the Euro by N10.54 to N1,591.92/€1 from N1,602.46/€1.
Yesterday was the last trading session of the week for the local currency in the spot market, as the market will be closed on Friday and Monday for the Easter Holiday.
At the black market, the Nigerian Naira maintained stability against the greenback yesterday at N1,405/$1, but gained N8 at the GTBank FX counter to settle at N1,388/$1, in contrast to the previous session’s N1,396/$1.
Pressure eased on the domestic currency as strong policy indicators have helped calm the majority of worries within the financial systems. Particularly in the remittance segment, the apex bank has directed all International Money Transfer Operators (IMTOs) to route remittance transactions through designated Naira settlement accounts in banks, a move aimed at boosting transparency and channelling more foreign exchange into the formal market.
This helps take off pressure from the foreign reserves, which have fallen below the $50 billion mark as they are gradually decreasing rather than falling sharply.
Meanwhile, the cryptocurrency market was bullish on Thursday, as macro sentiment shifted against recent optimism after reports that Iran is drafting a protocol with Oman to manage traffic through the Strait of Hormuz, easing concerns about disruptions to a key global oil route.
The remarks came after U.S. President Trump on Wednesday night vowed to hit Iran “extremely hard” in the coming weeks and that the Strait of Hormuz would “open naturally” once the war ends.
Cardano (ADA) chalked up 1.9 per cent to trade at $0.2435, Dogecoin (DOGE) grew by 1.2 per cent to $0.0912, Ethereum (ETH) appreciated by 0.8 per cent to $2,066.37, Bitcoin (BTC) added 0.5 per cent to sell at $67,080.53, Solana (SOL) increased by 0.5 per cent to $79.91, and Ripple (XRP) jumped 0.2 per cent to $1.31.
Conversely, Binance Coin (BNB) dipped 0.7 per cent to $586.90, and TRON (TRX) depreciated by 0.3 per cent to $0.3147, while the US Dollar Tether (USDT) and the US Dollar Coin (USDC) closed flat at $1.00 each.
By Dipo Olowookere
The local stock market was relatively flat on Friday, as the bears and the bulls shared the spoils of war, though investor sentiment turned bullish compared with the preceding session’s bearish posture.
Data from the Nigerian Exchange (NGX) Limited showed that the All-Share Index (ASI) was marginally down by 4.66 points as it ended at 201,698.89 points versus Wednesday’s 201,703.55 points, and the market capitalisation slightly contracted by N3 billion to N129.806 trillion from N129.809 trillion.
Customs Street was shut on Friday because of the public holidays declared by the federal government today and next Monday.
Business Post reports that John Holt declined by 9.91 per cent to N15.45, Abbey Mortgage Bank shed 9.60 per cent to trade at N8.95, International Energy Insurance slipped by 6.48 per cent to N3.32, Chams shrank by 5.30 per cent to N3.75, and Tantalizers depreciated by 5.18 per cent to N4.03.
On the flip side, Unilever Nigeria improved by 10.00 per cent to N103.40, Fortis Global Insurance gained 9.82 per cent to trade at N1.23, Multiverse appreciated 9.81 per cent to N20.15, Legend Internet advanced by 9.38 per cent to N6.30, and Zichis grew by 9.02 per cent to N14.14.
The market breadth index was positive during the trading session, as there were 35 appreciating stocks and 24 depreciating stocks.
Yesterday, investors traded 560.0 million equities valued at N19.3 billion in 49,676 deals, in contrast to the 815.5 million equities worth N33.3 billion transacted in 52,641 deals in the preceding day, representing a drop in the trading volume, value, and number of deals by 31.33 per cent, 42.04 per cent, and 5.63 per cent, respectively.
Secure Electronic Technology dominated the activity log with 59.7 million shares valued at N61.1 million, Wema Bank exchanged 52.0 million equities worth N1.4 billion, VFD Group transacted 36.0 million stocks for N410.5 million, Access Holdings sold 35.3 million shares valued at N914.8 million, and Chams traded 31.0 million equities worth N115.0 million.
-
 Feature/OPED6 years ago
Davos was Different this year
-
Travel/Tourism10 years ago
Lagos Seals Western Lodge Hotel In Ikorodu
-

 Showbiz3 years ago
Estranged Lover Releases Videos of Empress Njamah Bathing
-
 Banking8 years ago
Sort Codes of GTBank Branches in Nigeria
-

 Economy3 years ago
Subsidy Removal: CNG at N130 Per Litre Cheaper Than Petrol—IPMAN
-

 Banking3 years ago
Sort Codes of UBA Branches in Nigeria
-

 Banking3 years ago
First Bank Announces Planned Downtime
-

 Sports3 years ago
Highest Paid Nigerian Footballer – How Much Do Nigerian Footballers Earn