Media OutReach
Results of the ixCrypto Index Series Quarterly Review (2025 Q1)
1. Constituent Review – ixCrypto Index Series
1.1 ixCrypto Index (“IXCI”)
The number of constituents will decrease to 18 constituents with 1 addition and 2 deletions.
Addition
- Hedera
Deletions
- Pepe
- Near Protocol
After the change, the free float adjusted market capitalization coverage is 83.10%*, while the 90-day-average volume is 74.47%* (excluding stable coin which has 6.65% of the total crypto universe). The constituents change above and recapping at 40% will be effective on 18 April 2025 (Friday).
Since the last review, there has been an increase in the crypto total market capitalization from USD2.89tn to USD3.14tn (+8.65%)#, and a decrease in the daily volume from USD152.20bn to USD122.17bn (-19.73%)#. Bitcoin remains as the largest crypto in the constituent list, with its price has decreased by 11.13% since the last review.
1.2. ixCrypto Portfolio Indexes
1.2.1 ixCrypto 5 Equal Weight Index (“IXEW5”) and ixCrypto 5 Square Root Index (“IXSR5”)
Additions
No addition
Deletions
No deletion
1.2.2 ixCrypto 10 Equal Weight Index (“IXEW10”) and ixCrypto 10 Square Root Index (“IXSR10”).
Additions
- Chainlink
- Stellar
Deletions
- Toncoin
- Shiba Inu
1.2.3 ixCrypto Altcoin 10 EW Index (“IXAEW10”) and ixCrypto Altcoin 10 SR Index (“IXASR10”).
Additions
- Stellar
- Sui
Deletions
- Toncoin
- Shiba Inu
1.3. ixCrypto BTC/ETH Indexes
As of 31st March 2025, the market capitalization represented by the two indexes IX Bitcoin Index (IXBI) and IX Ethereum Index (IXEI) in ixCrypto BTC/ETH 5050 Index (“IX5050”) was 56.20%/43.80% respectively, a change from 43.69%/56.31% from 31st December 2024. The weight of IXBI & IXEI within IX5050 will be adjusted back to approximately 50%/50% respectively (estimated using 31st March 2025 prices), at the effective date.
As of 31st March 2025, the market capitalization represented by the two indexes IXBI and IXEI in ixCrypto BTC/ETH Proportional Index (“IXPI”) was 56.20%/43.80% respectively.
The new weight of IXBI and IXEI within the IXPI will be adjusted back to approximately 88.23/11.77% (estimated using 31st March 2025 prices) to restore their relative weight in the cryptocurrencies market at the effective date.
2. Constituent Review- IX Digital Asset Industry Index Series
2.1 ixCrypto Stablecoin Index
The number of constituents will decrease to 4 with no addition and 1 deletion. Stablecoin comprises 6.65% of the total crypto universe, and ixCrypto Stablecoin Index covers around 98.64% of the 90-day average market capitalization in stablecoin universe.
Addition
No addition
Deletion
- First Digital USD
2.2 ixCrypto Infrastructure Index
The number of constituents will remain unchanged at 23 with no addition and no deletion.
Additions
No addition
Deletion
No deletion
3. Exchange Review
As a result of exchange review, 8 exchanges passed the review process, which are as follows:
- Binance
- Bybit
- Coinbase Advanced
- OKEX
- Gate.io
- Bitrue
- Bitget
- Whitebit
Removed Exchanges
- Upbit
- DigiFinex
The selected 8 exchanges will be taken to generate each of the fair average prices for the IX Aaia indexes’ constituents. The exchange review covers volume rankings, exchange background checking, founders’ background checking, USD/USDT/USDC/BTC pairs coverage, overconcentration rules, exchange API coverage checking and stability etc for an exchange.
For more details about our exchange selection criteria, please email [email protected]
More details about the ixCrypto index, including their constituents, constituents’ weight are provided in the Appendices, or refer to the website https://ix-index.com/
*Exclude stable coins and exchange coins (based on conflict-of-interest rule methodology effective Oct 2, 2020)
#As of 31st March 2025, based on past 90 days average
Appendix 1
| Universe | All crypto coins traded in at least two different exchanges around the world |
| Selection Criteria | Cryptocurrencies ranking in the top 80% of cumulative full market capitalization (“MC”) coverage and within an acceptable range in accordance with the Volume Buffer Rule in terms of 90-day average trading volume |
| Number of Constituents | Variable/18 in Q1 2025 |
| Launch Date | 12th December 2018 |
| Base Date | 3rd December 2018 |
| Base Value | 1,000 |
| Reconstitution Rule | If the coverage is below 75% or any of constituents is not within an acceptable range in accordance with the Volume Buffer Rule in terms of 90-day average trading volume, IXCI will be reconstituted to bring MC coverage back and do liquidity screening. |
| Reconstitution and Rebalancing Frequency | Quarterly and with a fast entry rule |
| Weighting Methodology | Free float adjusted market capitalization weighted with a cap of 40% |
| Currency | US Dollar |
| Dissemination | Every 5 seconds for 24×7
(On Bloomberg, Reuters and major information vendors) |
| Website | https://ix-index.com/ |
| Crypto | 90-day-average- Market Cap | 90-day-average-volume * | Cut-off Price |
Cumulative Market Coverage before Cap |
Weighting (%) After 40% Cap# | |
| 1 | Bitcoin | $ 1,853,706,299,098 | $ 44,335,293,590 | 82334.52 | 59.07% | 40.00% |
| 2 | Ethereum | $ 324,029,915,475 | $ 23,391,114,110 | 1806.22 | 69.39% | 23.56% |
| 3 | XRP | $ 147,586,504,307 | $ 7,512,441,885 | 2.14 | 74.09% | 13.44% |
| 4 | Solana | $ 88,521,847,638 | $ 5,227,247,283 | 124.64 | 76.91% | 6.90% |
| 5 | Dogecoin | $ 39,041,680,047 | $ 2,512,936,991 | 0.17 | 78.16% | 2.67% |
| 6 | Cardano | $ 29,530,840,898 | $ 1,400,106,794 | 0.66 | 79.10% | 2.52% |
| 7 | TRON | $ 21,041,656,451 | $ 756,877,826 | 0.23 | 79.77% | 2.38% |
| 8 | Chainlink | $ 11,988,550,347 | $ 677,353,909 | 13.39 | 80.15% | 0.95% |
| 9 | Avalanche | $ 11,437,915,217 | $ 449,968,255 | 18.86 | 80.52% | 0.85% |
| 10 | Stellar | $ 10,666,634,081 | $ 502,743,927 | 0.27 | 80.86% | 0.89% |
| 11 | Sui | $ 10,563,860,585 | $ 1,259,649,871 | 2.35 | 81.19% | 0.81% |
| 12 | Toncoin | $ 10,373,541,695 | $ 206,364,392 | 3.90 | 81.52% | 1.05% |
| 13 | Hedera | $ 9,897,358,921 | $ 538,624,996 | 0.17 | 81.84% | 0.77% |
| 14 | Shiba Inu | $ 9,851,176,835 | $ 382,240,482 | 0.00 | 82.15% | 0.79% |
| 15 | Polkadot | $ 8,309,611,370 | $ 273,561,329 | 4.04 | 82.42% | 0.68% |
| 16 | Litecoin | $ 8,265,200,782 | $ 965,042,550 | 86.00 | 82.68% | 0.70% |
| 17 | Bitcoin Cash | $ 7,375,185,883 | $ 342,182,940 | 298.85 | 82.92% | 0.64% |
| 18 | Uniswap | $ 5,914,239,713 | $ 251,139,351 | 5.87 | 83.10% | 0.40% |
* 90-day-average-volume ranking in total market is shown in the parentheses
# Weighting (%) after 40% Cap is adjusted according to the cut-off price, the arrangement of order may not be the same as 90-day-average-Market Cap
Selection of index constituents is based on the past 90-day-average market capitalization and volume.
For the calculation methodology of the index, please refer to the “ixCrypto Index Methodology Paper” on our website
Appendix 3
Weightings of the Constituents of ixCrypto Portfolio Indexes
| Index Constituents | ixCrypto 5 EW Index | ixCrypto 5 SR Index | ixCrypto 10 EW Index | ixCrypto 10 SR Index | ixCrypto Altcoin 10 EW Index | ixCrypto Altcoin 10 SR Index |
|
| 1 | Bitcoin | 20.00% | 50.97% | 10.00% | 41.48% | – | – |
| 2 | Ethereum | 20.00% | 18.62% | 10.00% | 15.15% | 10.00% | 24.71% |
| 3 | XRP | 20.00% | 14.06% | 10.00% | 11.44% | 10.00% | 18.66% |
| 4 | Solana | 20.00% | 10.08% | 10.00% | 8.20% | 10.00% | 13.37% |
| 5 | Dogecoin | 20.00% | 6.27% | 10.00% | 5.10% | 10.00% | 8.32% |
| 6 | Cardano | – | – | 10.00% | 4.95% | 10.00% | 8.08% |
| 7 | TRON | – | – | 10.00% | 4.81% | 10.00% | 7.85% |
| 8 | Chainlink | – | – | 10.00% | 3.04% | 10.00% | 4.96% |
| 9 | Avalanche | – | – | 10.00% | 2.88% | 10.00% | 4.68% |
| 10 | Stellar | – | – | 10.00% | 2.95% | 10.00% | 4.80% |
| 11 | Sui | – | – | – | – | 10.00% | 4.57% |
Weightings of the Constituents of ixCrypto BTC/ETH 50/50 Index
and ixCrypto BTC/ETH Proportional Index
| 90-day-average Crypto Market Cap | 90-day-average Crypto Volume | Index Level | Cumulative Market Cap Coverage | Weight in BTC/ETH 50/50 | Weight in BTC/ETH Proportional | |
| IXBI | $ 1,853,706,299,098 | $ 44,335,293,590 | 19871.37 | 59.07% | 50.00% | 88.23% |
| IXEI | $ 324,029,915,475 | $ 23,391,114,110 | 15484.61 | 69.39% | 50.00% | 11.77% |
Weightings of the Constituents of ixCrypto Stablecoin Indexes
| Crypto | 90-day-average- Market Cap | 90-day-average- volume |
Cut-off Price |
Cumulative Market Coverage before Cap |
Weighting (%) After 40% Cap | |
| 1 | Tether USDT | $ 140,886,211,125 | $96,063,792,876 | $1.00 | 4.49% | 40.00% |
| 2 | USDC | $ 54,040,686,289 | $9,493,000,348 | $1.00 | 6.21% | 40.00% |
| 3 | Ethena USDe | $ 5,731,179,447 | $102,739,821 | $1.00 | 6.39% | 9.89% |
| 4 | Dai | $ 5,365,464,578 | $ 1,731,621,623 | $1.00 | 6.56% | 10.11% |
Appendix 6
ixCrypto Indexes Dissemination
Real time indexes are disseminated every 5-second interval for 24×7 since 23 June 2022. The real-time indexes are available for viewing on the IX Crypto Index official webpage. For IXCI, IXBI and IXEI, the indexes are also available through Nasdaq Global Index Data Service (GIDS) with the tickers “IXCI”, “IXBI” and “IXEI”, with dissemination interval kept at 15-second unchanged.
The vendor tickers are shown below:
| Index Name | Bloomberg Ticker | Reuters Ticker | |
| Real-time | Delayed | ||
| ixCrypto Index | IXCI | IXCI2 | .IXCI |
| ixBitcoin Index | IXCBI | IXCBI2 | .IXBI1 |
| ixEthereum Index | IXCEI | IXCEI2 | .IXEI1 |
For data licensing and product, please contact us at [email protected].
For free API use on academic research or trial, please contact [email protected]
Hashtag: #IXAsia #ixCryptoIndex
The issuer is solely responsible for the content of this announcement.
About IX Asia Indexes and IX Asia Index Advisory Committee
IX Capital International Limited is an award-winning index and investment advisory company. The index business arm- IX Asia Indexes, providing real-time digital asset and innovative indexes, disseminated 24×7 globally and built on robust infrastructure. Since the launch of the first crypto benchmark index (“IXCI”) launched in Hong Kong in December 2018, the ixCrypto index series expand into 29 indexes designed for exchange futures product, mark to market and fund managers’ portfolio construction purposes. To ensure the professionality and impartiality of the index methodologies and operations, IX Asia Indexes has established its index advisory committee with representation from different industries, including fund management, exchanges, brokerage, financial blockchain experts, crypto service providers, etc. The committee will meet quarterly a year to discuss matters relating to the IX Asia Indexes, including to review and to comment the data sources, methodologies, and operations of IX Asia Indexes, to provide guidance to the future development of new IX Asia Indexes and to handle other issues and decisions on an as-needed basis.
IX Asia Indexes was awarded the Fintech Award (wealth investment and management) 2019 and 2021 organised by ETNet. It as well won an award for Startup of the Year and Basic Technology (Big Data) from Hong Kong Fintech Impetus Awards 2022 by Metro Broadcast and KPMG. It also won Asia Pacific Enterprise Achievement Award 2024 by Echolade. IX Asia Indexes completed its IOSCO compliance statement and obtained ISO/IEC 27001:2013 UKAS certification.
Website: https://ix-index.com/
Advisory Committee: https://ix-index.com/committee.htm
About IX Crypto Indexes
The ixCrypto index (“IXCI”) is the first crypto index launched in Hong Kong. It was launched on 12 December 2018. It is denominated in USD with a base value of 1000 and a base date on 3 December 2018. Designed to be easy to understand while providing a good representation of the crypto market, ixCrypto index aims to cover the top 80% of the cumulative free-float adjusted market capitalization in the crypto universe and, at the same time, the crypto currencies should fall within the top liquid cryptos ranked by trading volume in the 90 days preceding the review date. The index is to be reviewed quarterly and with a fast entry rule. Real time indexes are disseminated every 5-second for 24×7 since 23 June 2022. Real time index data together with ixBitcoin Index and ixEthereum Index can be obtained from IX Asia Indexes Data Services and Bloomberg terminal on IXCI <GO>. For IXCI, IXBI and IXEI, the indexes are also available through Nasdaq Global Index Data Service (GIDS) with the tickers “IXCI”, “IXBI”, “IXEI”, with dissemination interval kept at 15-second unchanged.
The Taiwan-born pet mobility brand opens its first SoHo pop-up inside Flying Solo, bringing its Nordic-designed pet stroller collection to the heart of New York City.
NEW YORK, USA – Media OutReach Newswire – 02 April 2026 – FikaGO, the design-led pet mobility brand recognized across Asia and Europe, has opened its first New York City pop-up store inside Flying Solo in SoHo. The opening marks a deliberate move for a pet brand into one of the world’s most competitive retail districts.
Since entering the online American market in 2025, FikaGO has built a growing community of pet parents who see their animals as a central part of everyday life. Positioned as lifestyle essentials rather than conventional pet gear, FikaGO’s range of products is designed for people who want the best for their fur babies.
“We’ve always believed that pet products should not only be functional, but also beautifully integrated into everyday life.” — Eric Guu, Co-founder, FikaGO
SoHo was a considered choice: Flying Solo, with locations in New York and Paris, is known for championing independent design with a distinctly global sensibility.
The pop-up showcases FikaGO’s auto-folding Free To Go 2 in Sandy Beige, the brand’s bestselling product. All FikaGO’s products are manufactured using eco-friendly fabrics made from recycled materials, reflecting a commitment to sustainability. This includes their large-capacity Agile 2 pet strollers to their airline-approved Truffle carriers and the heavy-duty Kross pet wagon.
“Launching in SoHo is a meaningful milestone for us; it allows customers to truly experience the quality, design, and intention behind every FikaGO product.” — Eric Guu, Co-founder, FikaGO
As pet ownership rises globally, particularly among urban millennials and Gen Zs, demand for products that combine functionality, design, and lifestyle integration continues to grow. FikaGO was built for precisely this moment, and SoHo is precisely where that moment lives.
Visit the FikaGO pop-up at Flying Solo, 419 Broome Street, New York, or explore the full collection at https://us.fikago.com/.
Hashtag: #FikaGO #petmobilitybrand #petstroller #petcarrier #petwagon #petkennel #petbiketrailer
![]() https://us.fikago.com/
https://us.fikago.com/![]() https://www.facebook.com/FikaGO.US
https://www.facebook.com/FikaGO.US![]() https://www.instagram.com/fikago_us/
https://www.instagram.com/fikago_us/
YouTube: ![]() https://www.youtube.com/@fikago5910
https://www.youtube.com/@fikago5910
The issuer is solely responsible for the content of this announcement.
About FikaGO
FikaGO is a pet mobility brand founded in Taiwan, dedicated to crafting products that blend functionality, comfort, and modern aesthetics. With a presence across Asia and growing reach in Europe and the U.S, FikaGO is redefining everyday experiences between pets and their humans.
Media OutReach
Lee Kum Kee Celebrates Culinary Excellence at the Historic Hong Kong Debut of Asia’s 50 Best Restaurants 2026
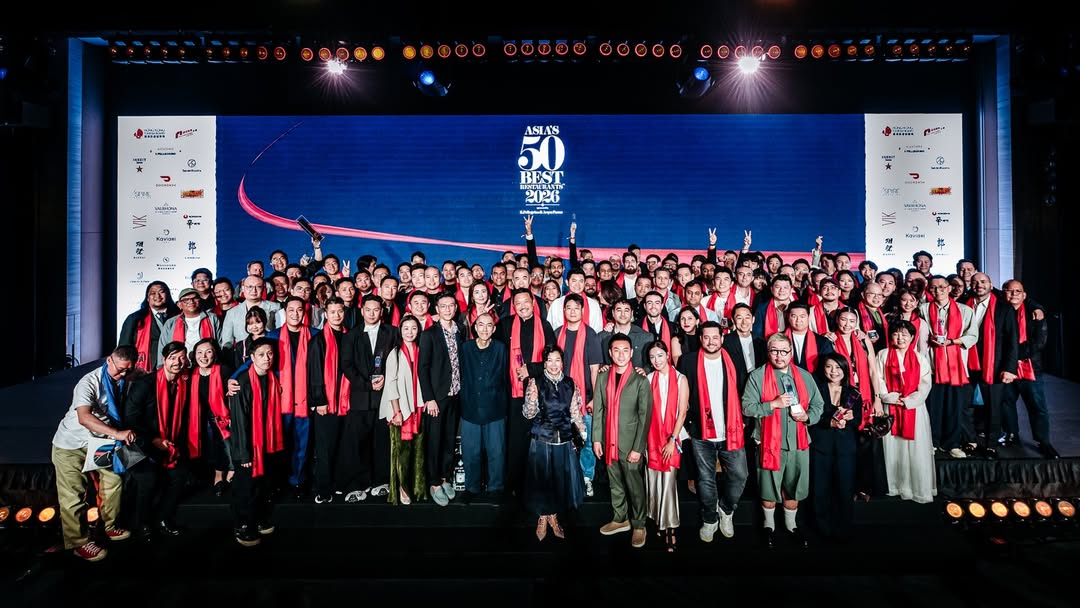
From 23-25 March, Lee Kum Kee brought together top chefs, diverse cultures and industry communities through a range of thoughtfully curated experiences, bringing authentic Asian flavours to the global stage. As well as reaffirming the brand’s Asian roots and international perspective, its involvement reflected an enduring commitment to preserving culinary heritage and driving gastronomic innovation.
“Asian Flavour Duet“: A Culinary Journey Through Heritage and Innovation
Helping to build momentums for this year’s awards, Lee Kum Kee collaborated with Vicky Cheng, the acclaimed Executive Chef and owner of WING, to co-create the “Asian Flavour Duet”, a Hong Kong-style late-night supper party on 24 March. Hosted at two Hong Kong culinary landmarks, the experience unfolded in two chapters – “Paying Tribute to Heritage” and “Innovative Fusion” – and invited guests to explore the limitless possibilities of Asian flavour.
The evening began at the century-old Lin Heung Lau teahouse, a space filled with nostalgia and memories for generations of Hong Kongers. Chef Vicky reinterpreted classic Hong Kong late-night dishes using signature Lee Kum Kee sauces, while guests were immersed in the warmth of the historic venue.
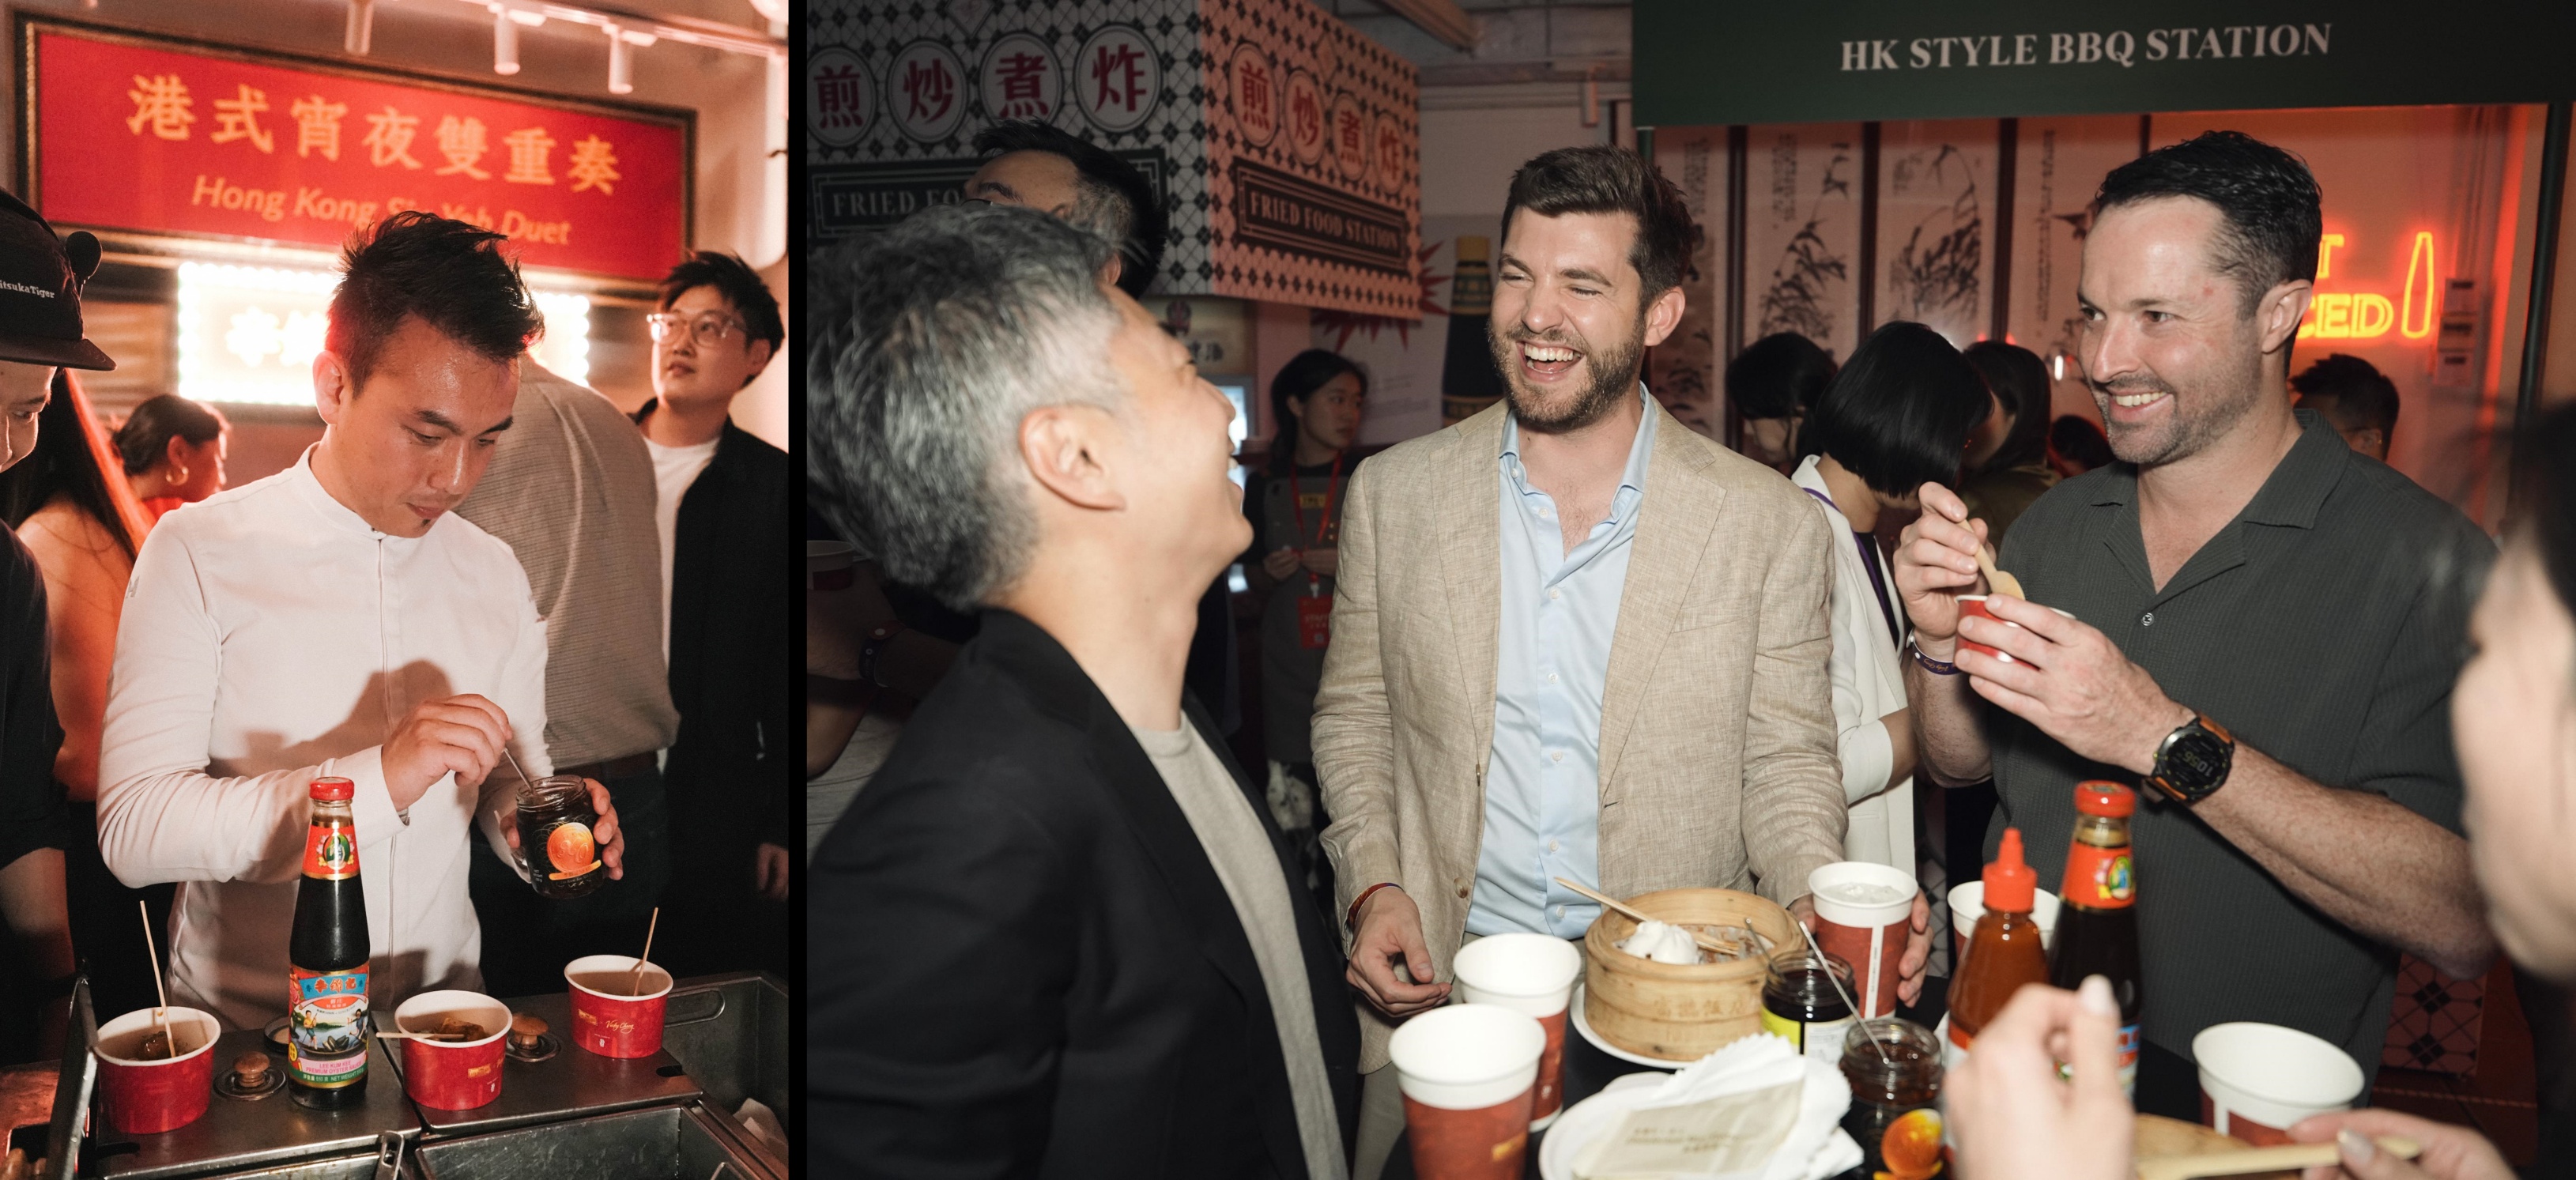
The celebration then moved to Medora, Chef Vicky’s Western dining space, where an “Innovative Fusion” was revealed. He showcased his modern culinary philosophy by incorporating Lee Kum Kee sauces with contemporary techniques to create bold, unexpected dishes. Guests also enjoyed specially crafted cocktails infused with Lee Kum Kee sauces, alongside a delightful yet refined sauce-inspired gelato, demonstrating a harmonious interweaving of savoury, umami, sweetness and spice.
The multisensory journey seamlessly blended tradition with innovation, exploring the future of cuisine while highlighting Lee Kum Kee’s role as a global gateway to Asian culinary culture.
At the event, Dodie Hung, Executive Vice President – Corporate Affairs at Lee Kum Kee, commented, “Tonight, we are honoured to celebrate Hong Kong’s late‑night food culture with Chef Vicky and the global culinary community. From the legacy of Lin Heung Lau to the forward‑looking spirit of Medora, we are proud to be part of the creative journey and help showcase the depth of Asian flavours on the world stage.”
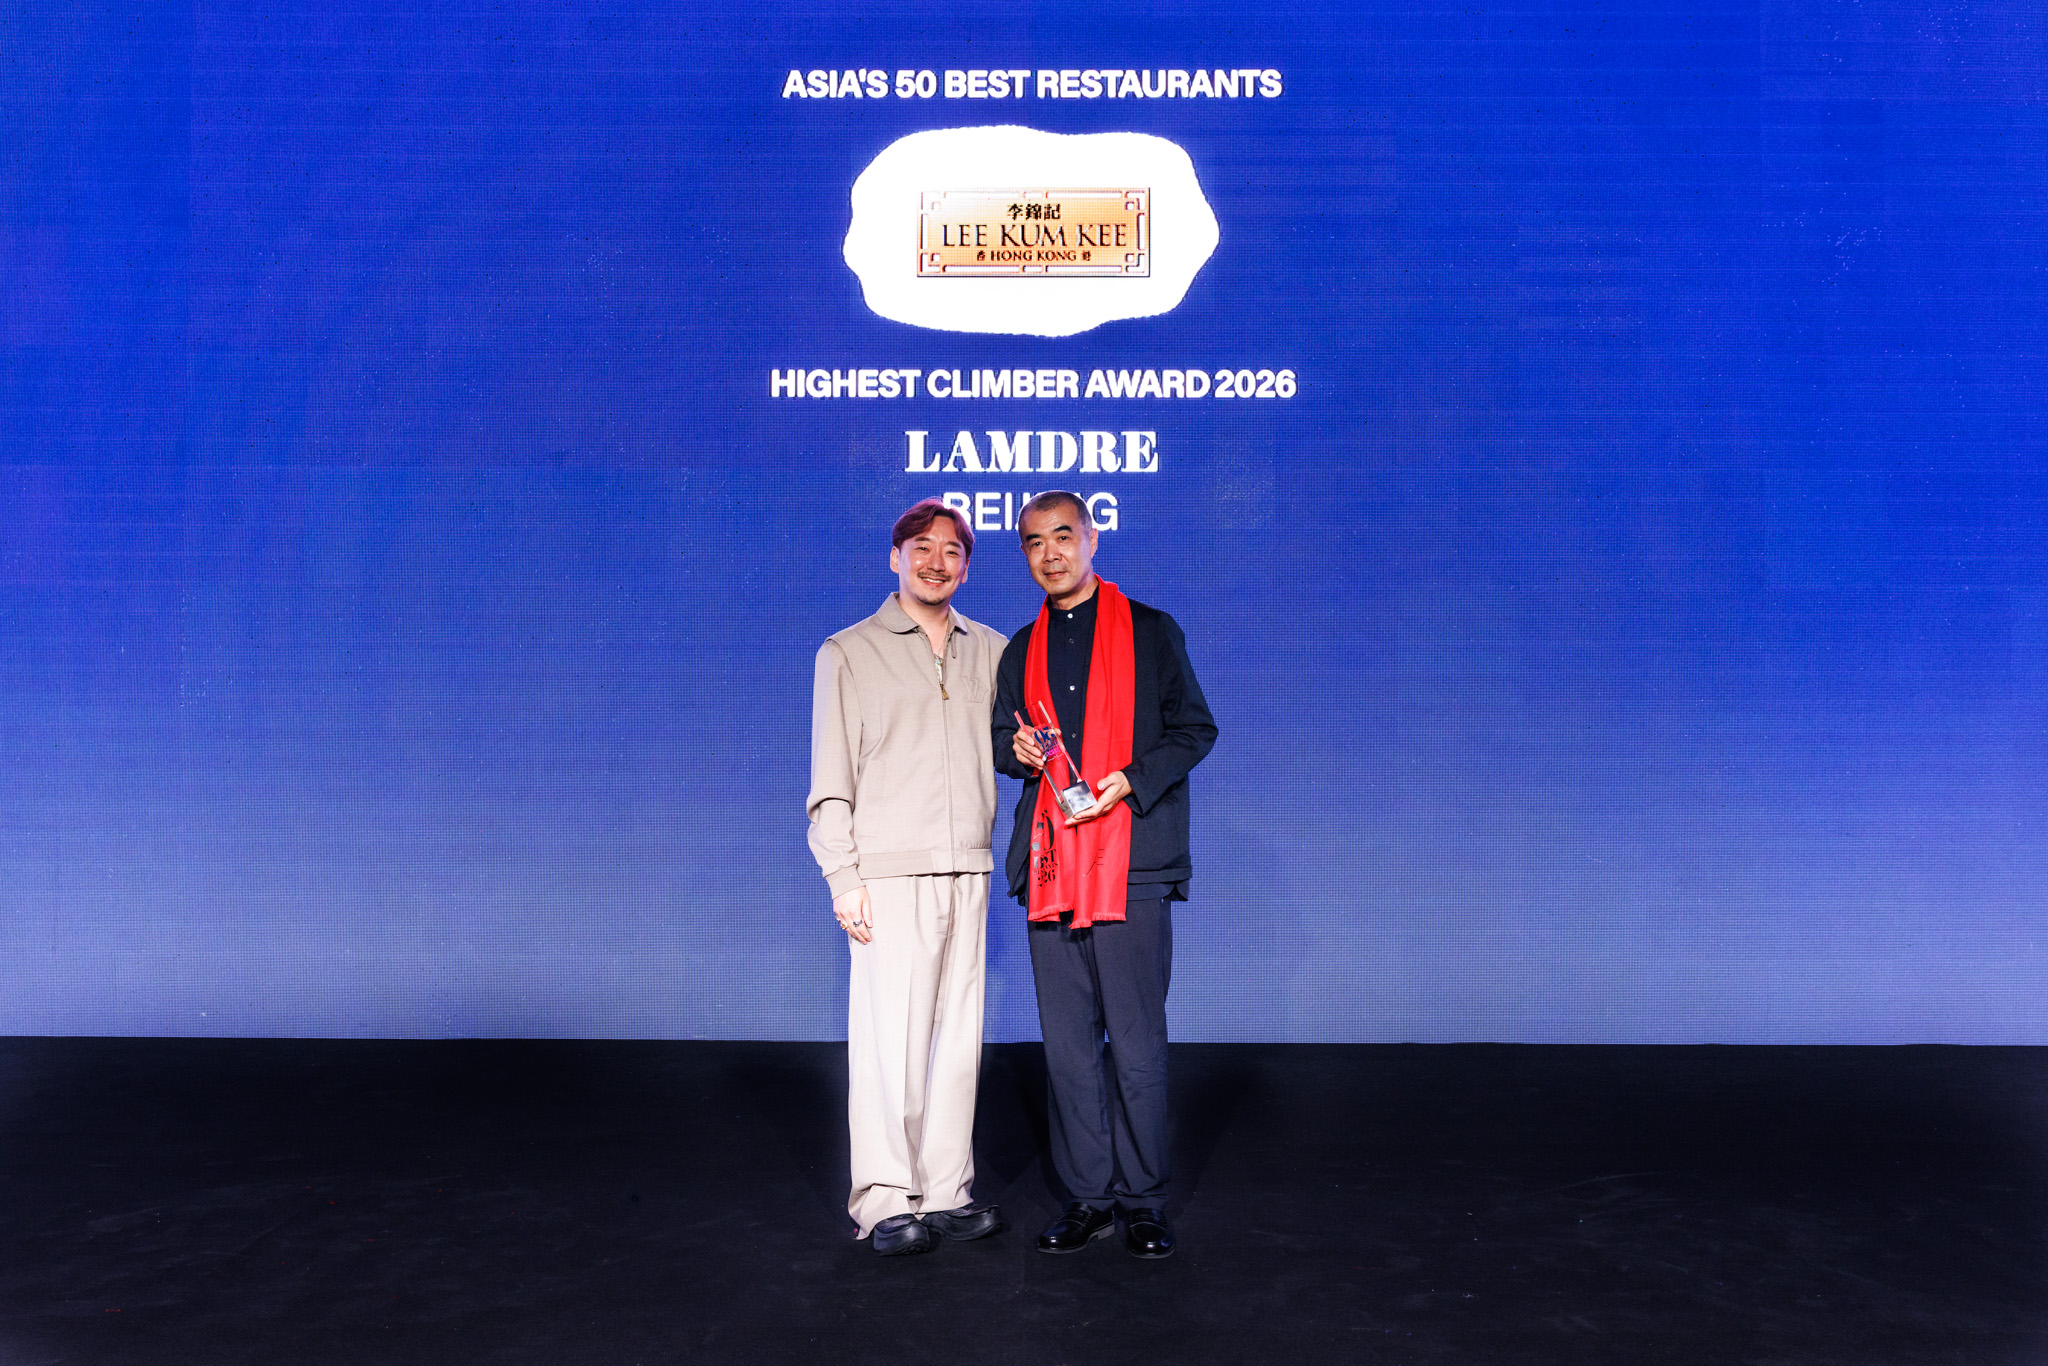
Celebrating a Gastronomic Brilliance with the Highest Climber Award Sponsored by Lee Kum Kee
During the awards ceremony on 25 March, Lee Kum Kee’s booth showcased a range of the brand’s acclaimed classic sauces and innovative products. Guests sampled specially crafted bites featuring Lee Kum Kee sauces, engaging directly with the flavours and techniques that have made the brand a trusted partner in both home and professional kitchens worldwide.

As part of the evening’s celebration of the region’s most exceptional culinary talents, the Highest Climber Award sponsored by Lee Kum Kee was presented to Lamdre in Beijing by Chef Park from Atomix (No.1 in North America’s 50 Best Restaurants 2025). Lambre was applauded for its pioneering plant-based dining space that promotes healthy, sustainable living while honouring Chinese biodiversity in its menus.
In addition, WING, led by Chef Vicky, achieved an impressive second place in 2026 Asia’s 50 Best Restaurants list. The restaurant had also previously ranked No. 11 on The World’s 50 Best Restaurants list in 2025, underscoring its continued international acclaim.
Building the Future Together: Deepening Global Partnerships
With the success of this prestigious awards ceremony in Hong Kong, China, Lee Kum Kee looks forward to deepening its collaboration with leading talents in the global culinary community. By continuing to champion Asian flavours and foster meaningful dialogue and exchange, the brand will continue to bring the spirit of Asian cuisine to kitchens and dining tables around the world.
Hashtag: #LeeKumKee #LKK
The issuer is solely responsible for the content of this announcement.
About Lee Kum Kee
Lee Kum Kee is the global gateway to Asian culinary culture, dedicated to promoting Chinese culinary culture worldwide. Since 1888, it has brought people together over joyful reunions, shared traditions and memorable meals. Beloved by consumers and chefs alike, Lee Kum Kee’s range of more than 300 sauces and condiments sparks creativity in kitchens everywhere, inspiring professional and home chefs to experiment, create and delight. Headquartered in Hong Kong, China and serving over 100 countries and regions, Lee Kum Kee’s rich heritage, unwavering commitment to quality, sustainable practices and “Constant Entrepreneurship” combine to enable superior experiences through Asian cuisine for people worldwide. For more information, please visit www.LKK.com.
About Asia’s 50 Best Restaurants
Launched in 2013, Asia’s 50 Best Restaurants aims to showcase the outstanding achievements and diverse culinary landscape of the region. The list is determined by the Asia’s 50 Best Restaurants Academy, a panel of over 350 culinary experts from across Asia who vote independently based on their specialised knowledge of the local dining scene. The Asia’s 50 Best Restaurants series includes the awards ceremony and list announcement, creating a premier networking platform for restaurateurs, media, seasoned travelers and culinary connoisseurs to celebrate the exceptional service, passion and talent in the dining industry.

- Herbert Vongpusanachai takes on the role of Senior Vice President for Commercial for the region, effective April 1, 2026
SINGAPORE – Media OutReach Newswire – 2 April 2026 – DHL Express, the world’s leading international express service provider, has appointed Herbert Vongpusanachai as Senior Vice President, Commercial for Asia Pacific, effective April 1, 2026. Herbert, who currently serves as Managing Director for DHL Express Thailand & Indochina, will be based in Singapore for his new role.
Herbert brings more than two decades of leadership experience within DHL Express, having successfully helmed multiple key markets across the region. He first joined the company in 2003 as Managing Director for Thailand & Indochina, later taking on leadership of Singapore in 2008, followed by Hong Kong & Macau in 2016. Since returning to lead Thailand & Indochina in 2020, he has driven sustained year‑on‑year profitable growth, transforming the cluster into one of the region’s key engines of expansion.
“Herbert has an exceptional track record of delivering strong business results while nurturing highly engaged teams across diverse markets. His deep understanding of our customers, collaborative leadership style, and ability to unearth opportunities in complex environments make him the ideal leader to drive our commercial agenda for Asia Pacific. I am confident that under his guidance, we will continue to accelerate sustainable growth across the region,” said Ken Lee, CEO for Asia Pacific, DHL Express.
In his new regional role, Herbert will shape and accelerate the commercial strategy for DHL Express across Asia Pacific by working with other functions to assess new sectors, routes and trade lanes with high potential for growth. He will focus on deepening customer engagement and supporting their expansion, while driving sustainable volume growth and advancing the adoption of new technologies to enhance commercial execution across markets. With his extensive country expertise and people‑first leadership style, Herbert is well‑positioned to support both regional and country teams in raising commercial performance to new levels.
“Asia Pacific remains an important anchor in global trade as seen in the latest DHL Global Connectedness Report, and this indicates the unwavering role of logistics to facilitate the flow of goods. With the newly introduced Heavyweight Express solution, which enables customers to ship heavyweight shipments with speed, certainty and reliability, I look forward to working alongside our talented teams to contribute to shaping the next chapter of DHL Express’s commercial success,” said Herbert Vongpusanachai, Senior Vice President – Commercial for Asia Pacific, DHL Express.
The latest DHL Global Connectedness Report shows that the region remains a major anchor of global commerce, with multiple economies rising in global connectedness rankings and Southeast Asia firmly establishing itself as a fast‑growing trade corridor. This also mirrors one of DHL Group’s strategies to better support 20 markets globally to accelerate growth; eight of them rest in Asia Pacific – underscoring the region’s critical role in DHL’s global network. As trade flows diversify and intra‑Asia integration deepens, this leadership appointment further strengthens DHL Express’s position in Asia Pacific.
Hashtag: #DHL
![]() https://group.dhl.com/en.html
https://group.dhl.com/en.html![]() https://www.linkedin.com/company/dhlexpress/
https://www.linkedin.com/company/dhlexpress/
The issuer is solely responsible for the content of this announcement.
DHL – The logistics company for the world
DHL is the leading global brand in the logistics industry. Our DHL divisions offer an unrivalled portfolio of logistics services ranging from national and international parcel delivery, e-commerce shipping and fulfillment solutions, international express, road, air and ocean transport to industrial supply chain management. With approximately 389,000 employees in more than 220 countries and territories worldwide, DHL connects people and businesses securely and reliably, enabling global sustainable trade flows. With specialized solutions for growth markets and industries including technology, life sciences and healthcare, engineering, manufacturing & energy, auto-mobility and retail, DHL is decisively positioned as “The logistics company for the world”.
DHL is part of DHL Group. The Group generated revenues of approximately 82.9 billion euros in 2025. With sustainable business practices and a commitment to society and the environment, the Group makes a positive contribution to the world. DHL Group aims to achieve net-zero emissions logistics by 2050.
-
 Feature/OPED6 years ago
Davos was Different this year
-
Travel/Tourism10 years ago
Lagos Seals Western Lodge Hotel In Ikorodu
-

 Showbiz3 years ago
Estranged Lover Releases Videos of Empress Njamah Bathing
-
 Banking8 years ago
Sort Codes of GTBank Branches in Nigeria
-

 Economy3 years ago
Subsidy Removal: CNG at N130 Per Litre Cheaper Than Petrol—IPMAN
-

 Banking3 years ago
Sort Codes of UBA Branches in Nigeria
-

 Banking3 years ago
First Bank Announces Planned Downtime
-

 Sports3 years ago
Highest Paid Nigerian Footballer – How Much Do Nigerian Footballers Earn