Economy
2016 Recap and 2017 Market Outlook
By Ambrose Omordion
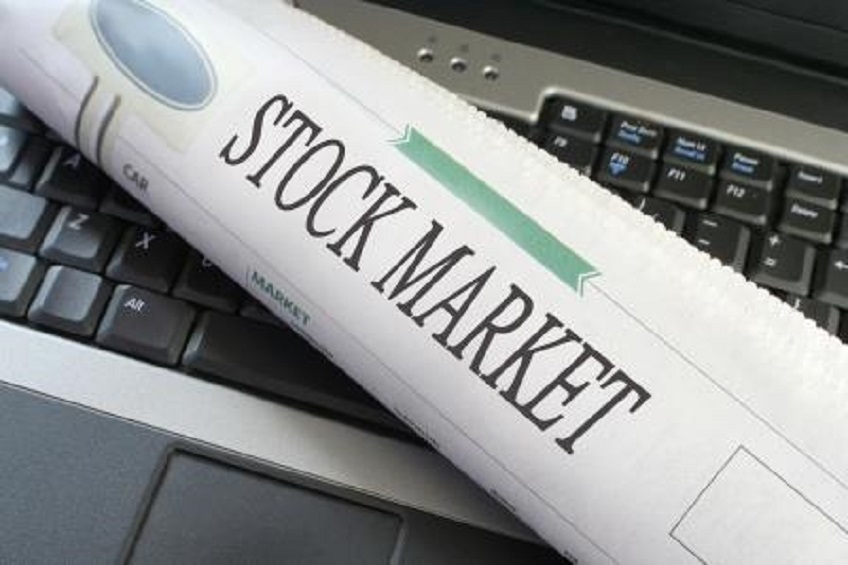
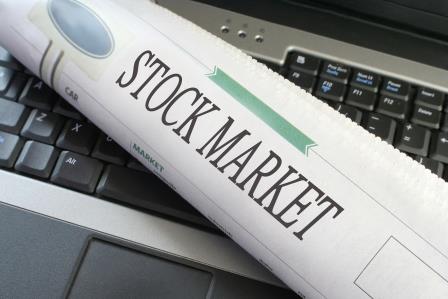
History has been made in the Nigeria capital market. For the third consecutive year, the benchmark All-Share Index of the Nigerian Stock Exchange (NSE) again contracted.
The 2016 contraction, unlike those of 2014 and 2015 was a single digit decline, fueling hope of a recovery soon.
The single digit contraction however resulted from the year-end seasonal trading volatility witnessed in the last few trading week of 2016, triggered by the low stock valuation and the agreement by members of the Organisation of Petroleum Exporting Countries (OPEC) to cut supply of crude oil to the international market as part of measures aimed at stabilizing oil prices.
The agreement was enhanced by the support of Russia, a major producer and non-member of the cartel, which also announced a cut in its production output. Market reaction to the news of the agreement which becomes effective this year, resulted in the gains by players in the NSE’s oil and gas sector as tracked via the Oil & Gas index.
The year 2016 was however rough for market players and analysts as unexpected events, negative economic data and company numbers continued to deepen to reflect the prevailing economic recession.
It is nonetheless obvious that during the year 2016, lack of concrete economic policies to give direction and the non-coordination of economic managers was also a major factor that affected domestic and international investor confidence in the market and the economy at large.
There was the impact of the delayed budget, coupled with the tight monetary policy regime adopted by the Central Bank of Nigeria (CBN).
The non-complementarity of fiscal and monetary policies was also evident, as both rather moved in opposite directions to the detriment of the masses, with the economy contracting in the first three quarters of the year as revealed by GDP numbers released by the National Bureau of Statistics (NBS).
The NBS on Saturday noted that if Nigeria must hold the unemployment rate at the current level of 13.9%, its economy must generate over 2.6 million annually, lamenting that the magnitude of employment in the country has not been sufficient to meet the ever-growing labour market, hence the continuous rise in the level of unemployment in the country.
The regulators of the market: SEC and NSE, recorded improvements despite the mixed general performance of the market for the year to close lower.
The development and growth of the nation capital market was highly driven by technology that continues to transform the face of the market and enhance transparency thereby restoring both domestic and international investors’ confidence in market activity.
Technology has also continued to make trading and investing simple with the online trading platforms that allows investors place trade from the comfort of their homes and offices, coupled with access to real market information that quicken investment decisions as more market operators creating online portals for their clients to trade directly on their own.
The composite index NSE ASI for the year shed 1765.68 points to close at 26,874.62 from an opening figure of 28,642.25 representing 6.16% decline after it had hit a high of 31,127.82 and low of 23,311.95 within the year under consideration.
The year started with a negative outlook in January which was characterized by the post-election fear of the leadership and economic management style of the new government, with share prices (especially of most blue-chips), volume and value recording new lows stocks, virtually all the indices crashed for that period.
They reversed up in February with oscillating movement that lasted five months, touching a high of 31,127.82points in June before pulling back to experience mixed performance of up and down movements, extending the periods of market bearishness that lasted for another five months (most notably from June to November) and these conditions made the latter part of the year quite interesting for many traders, before the end of the year rally reversed the bearish trend to close the month of December in green.
The Santa Claus rally effect was visible on the exchange.
The other leg of the market which is the primary market had low activity, compared with the previous years as all proposed Right Issues, public offers or initial public offers were postponed due to uncertainties and low confidence of investors in the market, despite all the efforts of market regulator to admit more companies to the exchange. One company was however admitted for listing at the alterative market sector during the year.
As the market repositions to play its role in the nation’s economic development, government must introduce policies that will attract small and medium companies to sources medium and long fund from the stock market.
The market’s sectoral indices showed that two out of the 11 indices closed the year positive. They are: which are NSE Premium index and NSE Banking Index with 6.98% and 2.17% respectively, while others were in red apparels.
The loss suffered by the market in 2016 was attributed to many factors including unstable global financial market resulting from low price of crude oil at the beginning of the year, sell down in china’s equity market, unexpected vote by Britons to leave the Eurozone and the unexpected victory of U.S president-elect Donald Trump.
Also on the local scene, there were the effects of high interest rate, hyperinflation, high unemployment and low national output that led to the ongoing recession that affected the general earning power of Nigerian that to no savings no investment. Liquidity was also a challenge, with its negative effect on the market, leaving the scene for foreign portfolio investors who tend to be unstable, moving in any direction as dictated by owners of the funds who combed in and out of the market.
The situation was not helped by the failure of the registered market makers to take off, as they are financially handicapped to play the role of stabilizing the system.
The regulators of the financial market need to come together to fashion ways that funds can flow into the market to ensure it performs its role in economic development and growth effectively.
Moreover, we would like to share our top trading themes in 2017 and where stocks, sectors, domestic and global economies are headed in the first quarter of 2017 and beyond.
In our INVEST 2017 SUMMIT held on December 3, 2016, top 10 recession proof stocks were discussed as only 18 stocks out of 219 listed companies that will grow their dividend for 2017 were recommended for investors and traders that participated at that event and these are companies with strong earnings capacity and support high pay-out ratios and high dividend yields with returns better than those of fixed income assets and cushion against the nation’s inflation rate, while the NSEASI posted a loss of 6.16 per cent in the same period. Other stocks can be traded with Technical Analysis using Support and Resistant trend line.
Over the past year the three stocks that recorded triple digits appreciation in price have recovered from 2015 down sell as a result of positive market sentiments and strong financials. Also, 13 equities recorded two digits capital growth for the same period to create value for investors.
In all, a total of 27 stocks, including the single digit gainers, were the best performing for the year.
The top five are Dangote Flour with 276.11% gain; United Capital, 108.4% capital appreciation; while Total Nigeria, Seplat and Mobil Oil recorded capital growth of 103.39%, 87.19% and 74.38% respectively. The domination of the top gainers’ table by petroleum stocks may likely continue in the New Year with other stocks that had performed well within the period.
On the flip side, over 55 stocks were among the worst performers for the year.
The top five are: Forte Oil that lost 74.42%; and Skye Bank, 68.35%; while Calverton, Diamond Bank and Sterling Bank were down by 63.56%, 61.74% and 58;47% respectively.
For profitable stock market investment and trading in the new year, get our INVEST 2017 TRADERS & INVESTORS SUMMIT home study pack for your guide in taking advantage of the next earnings season in 2017.
It is true that stocks are selling relatively at a low valuation now due to prolonged down market that was triggered by the exit of foreign investors in the market as result of falling oil prices and post-election uncertainties of the new government that created confidence crisis. But with the little improvement recorded in the Q3 GDP figures, despite still being negative, the contraction is reducing when you look at the change in Q1 GDP of -0.40, Q2 of -2.02 and Q3 of -2.24 which is a pointer that Q4 may likely be lower still to continue in a positive light especially as we expect the government to review and improve on its fiscal policies to boost productivity in the new year with the N7.3 trillion budget proposal for 2017.
Also it is expected that the CBN in the New Year should review its one-sided monetary policy in view of the need for greater collaboration in 2017 to save the nation from continued recession. The gradual return of foreign portfolio investors due to expected improvement in the nation’s reserve and implementation of the OPEC agreement in this first quarter of 2017. Also, it will boost government’s revenue and enhance implementation of the budget if passed earlier, given that the budget benchmark is $42.5 per barrel of oil, at a time it is already trading above $55.
In the New Year, investors should target stocks in the following industries: building material, construction, hospitality, energy, agriculture, financial and services that had suffered losses due to a bearish market that still has strong earnings power that can drive the price up again.
The global economy is likely to remain unstable, despite the expected increase in crude oil price in January as Britons prepare to exit the Eurozone and policy change in US by the new government which may likely redirect flow of funds.
Investors should be optimistic about the New Year as our comprehensive outlook for 2017 for publication next week and the outcome of the INVEST 2017 TRADERS & INVESTORS SUMMIT reveal a bullish signal for the year.
The chart below highlights the day change of the All Share Index for the entire year, with up days represented in green and down days in red. January march, May, June, July October, November and December were definitely the most volatile months of the year.
https://trwstockbrokers.wordpress.com/2017/01/02/2016-recap-and-2017-market-outlook/amp/
Economy
Adedeji Urges Nigeria to Add More Products to Export Basket

By Adedapo Adesanya
The chairman of the Nigeria Revenue Service (NRS), Mr Zacch Adedeji, has urged the country to broaden its export basket beyond raw materials by embracing ideas, innovation and the production of more value-added and complex products
Mr Adedeji said this during the maiden distinguished personality lecture of the Faculty of Administration, Obafemi Awolowo University (OAU), Ile-Ife, Osun State, on Thursday.
The NRS chairman, in the lecture entitled From Potential to Prosperity: Export-led Economy, revealed that Nigeria experienced stagnation in its export drive over three decades, from 1998 to 2023, and added only six new products to its export basket during that period.
He stressed the need to rethink growth through the lens of complexity by not just producing more of the same stuff, lamenting that Nigeria possesses a high-tech oil sector and a low-productivity informal sector, as well as lacking “the vibrant, labour-absorbing industrial base that serves as a bridge to higher complexity,” he said in a statement by his special adviser on Media, Dare Adekanmbi.
Mr Adedeji urged Nigeria to learn from the world by comparative studies of success and failure, such as Vietnam, Bangladesh, Indonesia, South Africa, and Brazil.
“We are not just looking at numbers in a vacuum; we are looking at the strategic choices made by nations like Vietnam, Indonesia, Bangladesh, Brazil, and South Africa over the same twenty-five-year period. While there are many ways to underperform, the path to success is remarkably consistent: it is defined by a clear strategy to build economic complexity.
“When we put these stories together, the divergence is clear. Vietnam used global trade to build a resilient, complex economy, while the others remained dependent on natural resources or a single low-tech niche.
“There are three big lessons here for us in Nigeria as we think about our roadmap. First, avoiding the resource curse is necessary, but it is not enough. You need a proactive strategy to build productive capabilities,” he stated, adding that for Nigeria, which is at an even earlier stage of development and even less diversified than these nations, the warning is stark.
“Relying solely on our natural endowments isn’t just a path to stagnation; it’s a path to regression. The global economy increasingly rewards knowledge and complexity, not just what you can dig out of the ground. If we want to move from potential to prosperity, we must stop being just a source of raw materials and start being a source of ideas, innovation, and complex products,” the taxman stated.
He added that President Bola Tinubu has already begun the difficult work of rebuilding the economy, building collective knowledge to innovate, produce, and build a resilient economy.
Economy
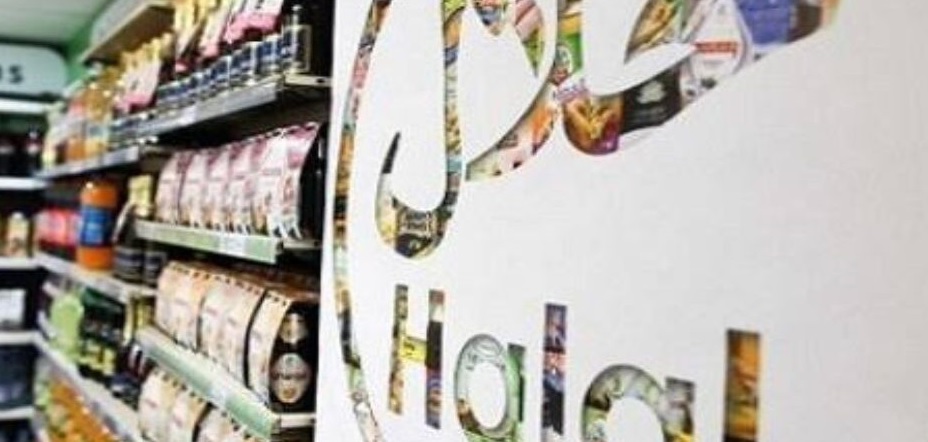
Nigeria Inaugurates Strategy to Tap into $7.7trn Global Halal Market
By Adedapo Adesanya
President Bola Tinubu on Thursday inaugurated Nigeria’s National Halal Economy Strategy to tap into the $7.7 trillion global halal market and diversify its economy.
President Tinubu, while inaugurating the strategy, called for disciplined, inclusive, and measurable action for the strategy to deliver jobs and shared prosperity across the country.
Represented by Vice-President Kashim Shettima, he described the unveiling of the strategy as a signal of Nigeria’s readiness to join the world in grabbing a huge chunk of the global halal economy already embraced by leading nations.
“As well as to clearly define the nation’s direction within the market, is expected to add an estimated $1.5 billion to the nation’s Gross Domestic Product (GDP) by 2027. It is with this sense of responsibility that I formally unveil the Nigeria National Halal Economy Strategy.
“This document is a declaration of our promise to meet global standards with Nigerian capacity and to convert opportunity into lasting economic value. What follows must be action that is disciplined, inclusive, and measurable, so that this Strategy delivers jobs, exports, and shared prosperity across our nation.
“It is going to be chaired by the supremely competent Minister of Industry, Trade and Investment.”
The president explained that the halal-compliant food exports, developing pharmaceutical and cosmetic value chains would position Nigeria as a halal-friendly tourism destination, and mobilising ethical finance at scale,” by 2030.
“The cumulative efforts “are projected to unlock over twelve billion dollars in economic value.
“While strengthening food security, deepening industrial capacity, and creating opportunities for small-and-medium-sized enterprises across our states,” he added.
Allaying concerns by those linking the halal with religious affiliation, President Tinubu pointed out that the global halal economy had since outgrown parochial interpretations.
“It is no longer defined solely by faith, but by trust, through systems that emphasise quality, traceability, safety, and ethical production. These principles resonate far beyond any single community.
“They speak to consumers, investors, and trading partners who increasingly demand certainty in how goods are produced, financed, and delivered. It is within this broader understanding that Nigeria now positions itself.”
Tinubu said many advanced Western economies had since “recognised the commercial and ethical appeal of the halal economy and have integrated it into their export and quality-assurance systems.”
President Tinubu listed developed countries, including the United Kingdom, France, Germany, the Netherlands, the United States, Canada, Australia, and New Zealand.
“They are currently among the “leading producers, certifiers, and exporters of halal food, pharmaceuticals, cosmetics, and financial products.”
He stated that what these developed nations had experienced is a confirmation of a simple truth, that “the halal economy is a global market framework rooted in standards, safety, and consumer trust, not geography or belief.”
The president explained that the Nigeria national halal economy strategy is the result of careful study and sober reflection.
He added that it was inspired by the commitment of his administration of “to diversify exports, attract foreign direct investment, and create sustainable jobs across the federation.
“It is also the product of deliberate partnership, developed with the Halal Products Development Company, a subsidiary of the Saudi Public Investment Fund.
“And Dar Al Halal Group Nigeria, with technical backing from institutions such as the Islamic Development Bank and the Arab Bank for Economic Development in Africa.”
The Minister of Industry, Trade and Investment, Mrs Jumoke Oduwole, said the inauguration of the strategy was a public-private collaboration that has involved extensive interaction with stakeholders.
Mrs Oduwole, who is the Chairperson, National Halal Strategy Committee, said that the private sector led the charge in ensuring that it is a whole-of-government and whole-of-country intervention.
The minister stressed that what the Halal strategy had done for Nigeria “is to position us among countries that export Halal-certified goods across the world.
The minister said, “We are going to leverage the African Continental Free Trade Area (AfCFTA) to ensure that we export our Halal-friendly goods to the rest of Africa and beyond to any willing markets; participation is voluntary. “
She assured that as the Chairperson, her ministry would deliver on the objectives of the strategy for the prosperity of the nation.
The Chairman of Dar Al-Halal Group Nigeria L.td, Mr Muhammadu Dikko-Ladan, explained that the Halal Product Development Company collaborated with the group in developing the strategy.
“In addition to the strategy, an export programme is underway involving the Ministry of Trade and Investment, through which Nigerian companies can be onboarded into the Saudi Arabian market and beyond.£
Mr Dikko-Ladan described the Strategy as a landmark opportunity for Nigeria, as it creates market access and attracts foreign direct investment.
Economy
UK, Canada, Others Back New Cashew Nut Processing Plant Construction in Ogun

By Adedapo Adesanya
GuarantCo, part of the Private Infrastructure Development Group (PIDG), has provided a 100 per cent guarantee to support a $75 million debt facility for Robust International Pte Ltd (Robust) to construct a new cashew nut processing plant in Ogun State, Nigeria.
GuarantCo, under the PIDG is funded by the United Kingdom, the Netherlands, Switzerland, Australia, Sweden and Canada, mobilises private sector local currency investment for infrastructure projects and supports the development of financial markets in lower-income countries across Africa and Asia.
Nigeria is one of Africa’s largest cashew producers of 300,000 tonnes of raw cashew nuts annually, yet currently less than 10 per cent are processed domestically. Most raw nuts are exported unprocessed to Asian and other countries, forfeiting up to 80 per cent of their potential export value and adding exposure to foreign exchange fluctuations.
According to GuarantCo, this additional plant will more than double Robust’s existing cashew processing capacity from 100 metric tonnes per day to 220 metric tonnes per day to help reduce this structural gap.
The new plant will be of extensive benefit to the local economy, with the procurement of cashew nuts from around 10,000 primarily low-income smallholder farmers.
There is an expected increase in export revenue of up to $335 million and procurement from the local supply chain over the lifetime of the guarantee.
Furthermore, the new plant will incorporate functionality to convert waste by-products into value-added biomass and biofuel inputs to enhance the environmental impact of the transaction.
It is anticipated that up to 900 jobs will be created, with as many as 78 per cent to be held by women. Robust also has a target to gradually increase the share of procurement from women farmers, from 15 per cent to 25 per cent by 2028, as it reaches new regions in Nigeria and extends its ongoing gender-responsive outreach programme for farmers.
Terms of the deal showed that the debt facility was provided by a Symbiotics-arranged bond platform, which in turn issued notes with the benefit of the GuarantCo guarantee. These notes have been subscribed to in full by M&G Investments. The transaction was executed in record time due to the successful replication of two recent transactions in Côte d’Ivoire and Senegal, again in collaboration with M&G Investments and Symbiotics.
Speaking on the development, the British Deputy High Commissioner, Mr Jonny Baxter, said: “The UK is proud to support innovative financing that mobilises private capital into Nigeria’s productive economy through UK-backed institutions such as PIDG. By backing investment into local processing and value addition, this transaction supports jobs, exports and more resilient agricultural supply chains. Complementing this, through the UK-Nigeria Enhanced Trade and Investment Partnerships and the Developing Countries Trading Scheme, the UK is supporting Nigerian businesses to scale exports to the UK and beyond, demonstrating how UK-backed partnerships help firms grow and compete internationally.”
Mr Dave Chalila, Head of Africa and Middle East Investments at GuarantCo, said: “This transaction marks GuarantCo’s third collaboration with M&G Investments and Symbiotics, emphasising our efforts to bring replicability to everything we do so that we accelerate socio-economic development where it matters most. The transaction is consistent with PIDG’s mandate to mobilise private capital into high-impact, underfinanced sectors. In this case, crowding in institutional investors in the African agri-processing value chain.
“As with the two recent similarly structured transactions, funding is channelled through the Symbiotics institutional investor platform, with the notes externally rated by Fitch and benefiting from a rating uplift due to the GuarantCo guarantee.”
Adding his input, Mr Vishanth Narayan, Group Executive Director at Robust International Group, said: “As a global leader in agricultural commodities, Robust International remains steadfast in its commitment to building resilient, ethical and value-adding supply chains across origin and destination markets. This transaction represents an important step in advancing our long-term strategy of strengthening processing capabilities, deepening engagement with farmers and enhancing local value addition in the regions where we operate. Through sustained investment, disciplined execution and decades of operating experience, we continue to focus on delivering reliable, high-quality products while fostering inclusive and sustainable economic growth.”
For Ms María Redondo, director at M&G Investments, “The guarantee gives us the assurance to invest in hard currency, emerging market debt, while supporting Robust’s new cashew processing plant in Nigeria. It’s a clear example of how smart credit enhancement can unlock institutional capital for high-impact development and manage currency and credit risks effectively. This is another strong step in channelling institutional capital into meaningful, on‑the‑ground growth.”
Also, Ms Valeria Berzunza, Structuring & Arranging at Symbiotics, said: “We are pleased to continue our collaboration with M&G Investments, GuarantCo, and now with Robust through a transaction with a strong social and gender focus, demonstrating that well-structured products can boost commercially attractive, viable, and impactful investments.”
-

 Feature/OPED6 years ago
Davos was Different this year
-
Travel/Tourism9 years ago
Lagos Seals Western Lodge Hotel In Ikorodu
-

 Showbiz3 years ago
Estranged Lover Releases Videos of Empress Njamah Bathing
-
 Banking8 years ago
Sort Codes of GTBank Branches in Nigeria
-

 Economy3 years ago
Subsidy Removal: CNG at N130 Per Litre Cheaper Than Petrol—IPMAN
-
 Banking3 years ago
Sort Codes of UBA Branches in Nigeria
-

 Banking3 years ago
First Bank Announces Planned Downtime
-

 Sports3 years ago
Highest Paid Nigerian Footballer – How Much Do Nigerian Footballers Earn


