
Economy
Brent Hits $92, WTI $90 as War Raise Prices

By Adedapo Adesanya
Crude futures climbed 12 per cent on Friday due to disruptions to global oil supplies because of the expanding US-Israel war with Iran.
During the session, Brent crude futures settled at $92.69 a barrel after gaining $7.28 or 8.52 per cent, and the US West Texas Intermediate (WTI) crude futures finished at $90.90 a barrel, up $9.89 or 12.21 per cent.
In one week, WTI rose 35.63 per cent, and Brent climbed 27 per cent, the biggest weekly gains since the COVID-19 pandemic in 2020.
Disruptions to the Middle East supply and tanker traffic through the Strait of Hormuz continue to rattle global energy markets.
The strait is a narrow waterway which handles roughly a fifth of the world’s traded crude, making it one of the most critical chokepoints in the global oil system. Even partial disruptions or perceived risks to tanker traffic can trigger rapid price moves as traders scramble to price in supply uncertainty.
With the Strait now effectively closed for seven days, that means about 140 million barrels of oil have been unable to reach the market. Vessel traffic has effectively dropped from an average of 138 ships a day to around 1 or 2.
The conflict has spread across the Middle East’s key energy-producing areas, disrupting output and forcing shutdowns of refineries and liquefied natural gas plants.
Qatar’s energy minister told the Financial Times he expects all Gulf energy producers to shut down exports within weeks, a move he said could drive oil to $150 a barrel. Kuwait is also discussing cutting production even further, and refining operations as well, to levels that would match what would be needed domestically.
US President Donald Trump, in an interview, said he was not concerned about rising petrol prices linked to the conflict after he said the US government would step in to provide insurance coverage have yet to have an effect.
President Trump also said the US Navy would escort tankers in the strait earlier this week, but soon after, took it back, after the Navy itself said there was “no chance” of such escorts.

By Modupe Gbadeyanka
The federal government has been urged to give all the necessary support to indigenous investors, as they remain Nigeria’s most important drivers of employment, foreign exchange generation and long-term economic resilience.
This advice was given by foremost businessman, Mr Aliko Dangote, when he welcomed the Minister of State for Industry, Mr John Owan Enoh, to the Dangote Petroleum Refinery and Petrochemicals in Lagos recently.
The business mogul noted that efforts must be made to place industrialisation at the centre of the government’s economic strategy, insisting that no nation has attained prosperity without a strong manufacturing base.
“If Nigeria is to achieve sustainable growth and become a trillion-dollar economy, industrialisation must be the foundation. Indigenous investors remain the strongest catalysts for that transformation,” Mr Dangote stated.
He further stated that, “There is no way to create jobs and prosperity without industrialisation,” declaring that, “The greatest attraction for foreign investors is the success of domestic investors. When local investors thrive, they send a powerful signal that the environment is conducive for investment.”
In his remarks, the Minister promised deeper collaboration with the private sector to accelerate industrialisation, job creation and economic transformation.
He also pledged that the Ministry and its agencies would remain strong advocates of the refinery and the broader industrialisation agenda, adding that the government would continue to engage Dangote Industries Limited through the Industrial Revolution Work Group and ministerial roundtables to address challenges facing manufacturers, particularly access to affordable long-term financing.
Mr Enoh described the integrated industrial complex as one of the most significant investments in Africa and a model for the type of industrial development required to drive Nigeria’s economic growth aspirations.
“This facility matters because of what it represents for Nigerian industry, for our people and for the realisation of President Bola Tinubu’s vision of a one trillion-dollar economy,” he stated, noting that the refinery has emerged as a powerful symbol of value addition, industrial competitiveness and Nigeria’s growing manufacturing capability.
The Minister noted that the refinery has fundamentally changed global perceptions of Nigeria by helping to transform the country from a major importer of refined petroleum products into an exporter serving international markets.
“When global supply disruptions occurred, Nigeria was able to export petroleum products to markets in the Middle East and beyond. That is an extraordinary achievement and one that deserves recognition,” he added.
By Bon Peters
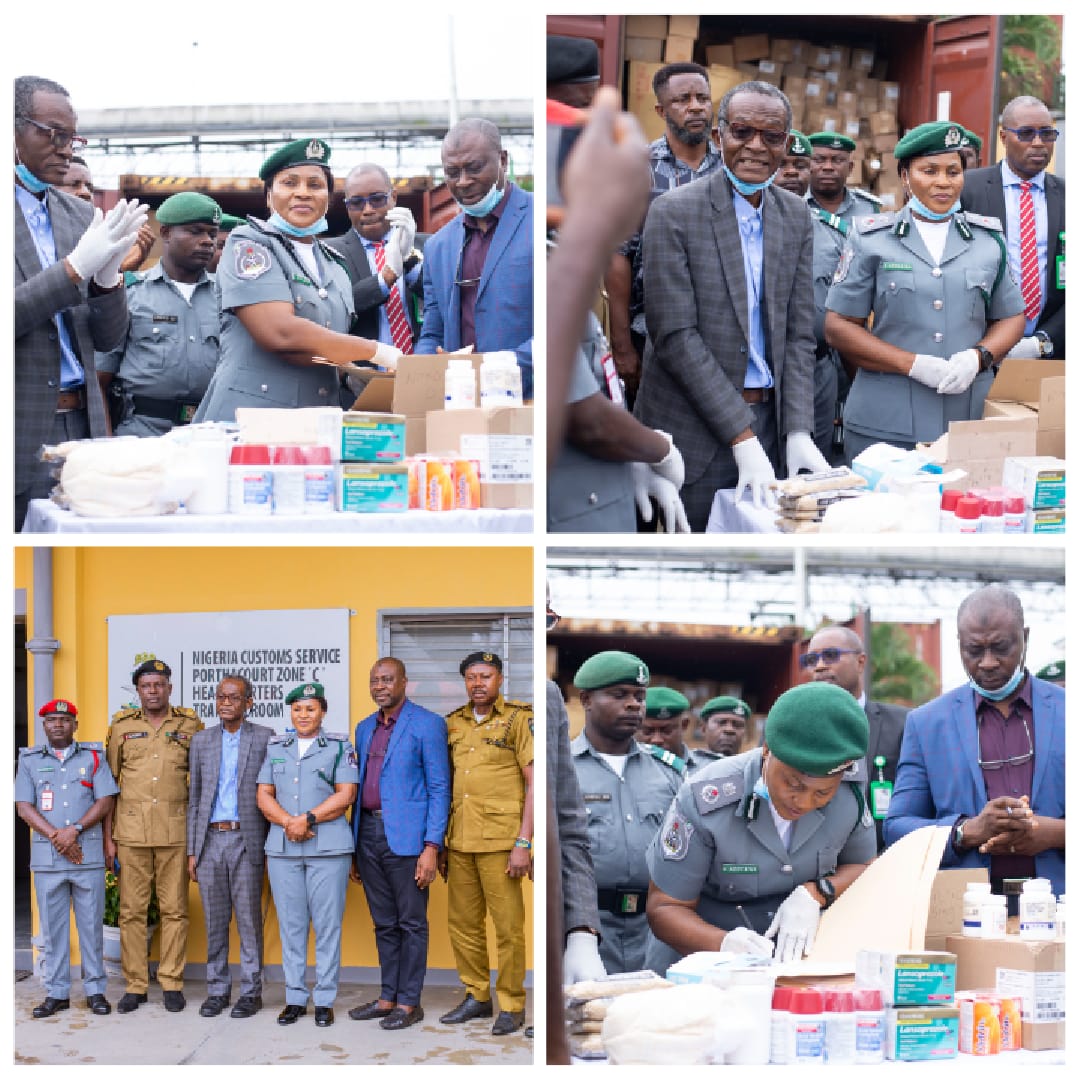
The Port Harcourt Area I Command of the Nigeria Customs Service (NCS) on Wednesday, July 29, 2026, handed over a consignment of intercepted expired medicaments to the National Agency for Food and Drug Administration and Control (NAFDAC) in Rivers State.
The command’s spokesperson, Barilule Aanee, an Assistant Superintendent of Customs I, said in a statement that the transfer of the items underscored the strong inter-agency collaboration in safeguarding public health.
The handover was witnessed by representatives of the National Drug Law Enforcement Agency (NDLEA), the Department of State Services (DSS), other security agencies, freight forwarding associations, stakeholders and members of the media.
The Customs Area Controller for the command, Comptroller Salamatu Atuluku, stated that the seizure was a clear demonstration of the agency’s commitment to preventing harmful and prohibited pharmaceutical products from finding their way into Nigerian markets, disclosing that the expired medicaments were intercepted during a joint examination conducted by officers of the command in collaboration with NAFDAC and other relevant agencies.
She added that the consignment contained several cartons of expired pharmaceutical products with a Combined Insurance and Freight (CIF) value of over N50 million.
Ms Atuluku emphasised that the interception prevented what could have resulted in serious public health consequences, as expired medicines posed significant health risks, including treatment failure, drug toxicity and antimicrobial resistance.
She reaffirmed that her organisation “would remain resolute in protecting the nation’s borders against the importation of expired, substandard, falsified and prohibited goods.”
Receiving the items, the Deputy Director of NAFDAC for Port Inspection Directorate, Mr Adepoju Bayo Raufu, commended the customs for its vigilance and sustained partnership in protecting Nigerians from harmful pharmaceutical products.
He assured that the agency would immediately commence the necessary regulatory procedures to ensure the safe disposal of the expired medicaments in accordance with established laws and guidelines.

By Adedapo Adesanya
United Capital Plc has unveiled an ambitious roadmap to surpass N2 trillion in total assets by the end of 2026, following a strong first-half performance that saw gross earnings rise by 58 per cent to N37.9 billion and profit before tax increase by 80 per cent.
The company disclosed this during its H1 investor relations call on Wednesday, where executives outlined plans to drive growth through digital transformation, Pan-African expansion, and disciplined capital management.
Speaking during the call, Group Managing Director of United Capital Plc, Mr Peter Ashade, said the company is undergoing a major “retooling” process to position itself for long-term growth beyond Nigeria.
“We are equipping from people, technology, governance, and our structure as we retool because what we see ahead is bigger than where we are today,” Mr Ashade said.
He noted that the firm’s long-term vision is to build a platform that allows clients to trade seamlessly across its African footprint, including Nigeria, Côte d’Ivoire, Ethiopia, Rwanda, Senegal and Burkina Faso.
Mr Ashade added that the company has deliberately reduced its borrowing in favour of expanding its managed funds business, which it considers its biggest growth opportunity.
“We have decided deliberately to reduce our borrowing so that we can focus on growing managed funds to about 71 per cent of our funding size, which is where we see the greatest opportunities for the group,” he said.
He disclosed that managed funds have recorded significant growth, while total assets have already exceeded the N1 trillion mark.
“Our target for this year is to do over N2 trillion in terms of total assets,” he added.
Providing a breakdown of the financial performance, Group Chief Financial Officer, Mr Shedrack Onakpoma, said profit before tax rose to N24.78 billion, significantly outpacing revenue growth as a result of improved operational efficiency.
“We are building a resilient and thriving institution of great repute that focuses on sustainable value creation and delivery across multiple markets,” Mr Onakpoma said.
“The numbers tell a story of innovation and how we are building a lasting legacy that goes beyond mere revenue growth or short-term profitability.”
Addressing shareholders’ concerns over the company’s 30 kobo interim dividend, the firm’s Chief Economist, Ayodele Akunwunmi, said the decision reflects a long-term capital allocation strategy anchored on the residual dividend theory.
“Residual dividend theory says that a company must finance all profitable investments available from internally generated cash flows before paying the residual to shareholders,” Mr Akunwunmi explained.
“By financing our expansion this way rather than borrowing money that would dilute earnings, we have the opportunity to grow the bottom line and potentially double profitability in the future.”
He urged shareholders to focus on the company’s broader value creation strategy, arguing that prioritising investment today would generate stronger returns over the long term.
