
Economy
Business Activity Falls First Time in Eight Months

By Modupe Gbadeyanka
The Stanbic IBTC Purchasing Managers’ Index (PMI) for July 2024 has indicated that the Nigerian private sector moved back into contraction territory.
A statement from the lender disclosed that the index of the performance of the business environment closed at 49.2 points compared with 50.1 points recorded in June as steep price pressures hit demand and resulted in renewed reductions in both business activity and new orders.
Business Post reports that readings above 50.0 signal an improvement in business conditions in the previous month, while readings below 50.0 show deterioration, which occurred in the period under review, the first in eight months.
Input costs and selling prices continued to rise rapidly, although there were some signs that efforts to secure sales resulted in a softer pace of output price inflation.
The renewed worsening in the health of the private sector mainly reflected the first reductions in output and new orders since November last year. In both cases, rates of decline were only modest.
Anecdotal evidence continued to highlight the negative impact of sharp price increases on customer demand, with clients often unwilling or unable to commit to new projects.
Three of the four broad sectors covered by the report saw business activity decrease in July, the exception being manufacturing where production increased.
Selling prices continued to increase sharply at the start of the third quarter as companies passed higher input costs through to their customers. This was despite the rate of inflation easing to the slowest since May 2023 amid reports from some panellists that they had lowered charges as part of efforts to secure sales.
The Head of Equity Research for West Africa at Stanbic IBTC Bank, Mr Muyiwa Oni, said, “The Stanbic IBTC headline PMI declined for the second consecutive month to 49.2 points in July – its lowest level since November 2023.
“Anecdotal evidence continued to highlight the negative impact of sharp price increases on customer demand, resulting in renewed reductions in both business activity and new orders.
“Notably, output and new orders printed below 50.0 thereby ending a seven-month sequence of expansion and reinforcing a renewed worsening in the health of the private sector.
“Even as output and new orders declined, companies continued to expand their staffing levels during the month. Moreover, the rate of job creation picked up to the strongest in 2024 so far.
“Meanwhile, overall input prices continued to rise sharply in July with the rate of inflation quickening for the third month running and were the fastest since March.
“Although output prices continued to rise rapidly during July, the pace of inflation eased from that seen in June and was the slowest since May 2023. Where selling prices increased, panellists linked this to higher input costs.
“On the other hand, some companies lowered charges as part of efforts to attract customers. That said, companies remained confident overall that output will increase over the next 12 months, reflecting business expansion plans including efforts to start exporting and open more branches.
“On a year-on-year basis, headline inflation may have peaked in June, with moderation expected in H2:24 as the year-on-year effects of PMS subsidy removal (which induced higher fuel prices) and significant currency depreciation (which accompanied the FX unification) fade.
“This, in addition to the commencement of the primary harvest season in September, is likely to provide some respite for consumers, thereby likely supporting a slight improvement in domestic economic activities in H2:24.”
Further increases in purchase prices and staff costs were registered in July. Purchase price inflation quickened to a four-month high, often due to currency weakness but also higher raw material costs.
Meanwhile, the rise in employee expenses was broadly in line with that seen in June as companies continued to help workers with higher living costs, particularly those related to transportation.
The renewed decline in output was accompanied by a reduction in business confidence, with firms at their least optimistic since the survey began. That said, business expansion plans meant that firms still expected output to rise over the coming year.
Companies scaled back purchasing activity, with reduced demand for inputs and prompt payments helping lead to a further shortening of suppliers’ delivery times.
Meanwhile, stocks of inputs increased. Employment also continued to rise slightly, with the pace of job creation quickening to the fastest in 2024 so far. Higher staffing levels and a drop in new orders meant that backlogs of work were cleared for the second consecutive month.

By Adedapo Adesanya
The chief executive of HBM Nigeria Plc (formerly Lafarge Africa), Mr Lolu Alade-Akinyemi, said the cement producer is expected to add 4.5 million tonnes to its production capacity by January 2027.
HBM Nigeria Plc is positioning itself for stronger long-term competitiveness, market leadership and job creation as it accelerates expansion projects.
The transition to HBM Nigeria marks a new phase of growth, driven by operational excellence, sustainability, innovation, and infrastructure development, while maintaining its long-standing commitment to Nigeria’s construction sector.
Mr Alade-Akinyemi, speaking recently in Lagos, said the ongoing expansion of the company’s Ashaka and Sagamu plants would significantly boost local production, create employment opportunities, and support businesses across its value chain.
“We recently announced the expansion of the Sagamu plant in Ogun State and the Ashaka plant in Gombe State. Hopefully, in January 2027, we will commission both plants, adding 4.5 million tonnes to our capacity. Traditionally, building a new plant takes about three years, but this is one of the benefits of belonging to the Huaxin Group,” he said.
According to him, the projects will generate employment, create opportunities for young people and women, strengthen local suppliers and contractors, and contribute further to Nigeria’s economic growth.
“There are many vacancies we are trying to fill in Sagamu and Ashaka. Beyond direct employment, we are creating opportunities for small businesses, developing suppliers and supporting local contractors. This is an exciting period because it will deliver significant benefits to Nigeria,” he said.
Mr Alade-Akinyemi noted that while the company’s corporate identity had changed following its acquisition by Huaxin Building Materials Group, its core values and commitment to customers, host communities, employees and shareholders remain unchanged.
He said HBM Nigeria traces its roots to 1959 as West African Portland Cement Company (WAPCO), with its first cement plant commencing operations in Ewekoro, Ogun State, in 1961.
Since then, he said, the company has grown into one of Nigeria’s leading building solutions providers with integrated plants in Ewekoro, Sagamu, Ashaka and Mfamosing.
He added that the company, which became publicly listed in 1979, has continued to expand through acquisitions and transformation while maintaining high product quality, innovation and responsible operations.
Highlighting the strengths of its parent company, Alade-Akinyemi described Huaxin Building Materials as a globally recognised building materials manufacturer founded in 1907 and headquartered in Wuhan, China, with operations across 16 regions in China and 14 countries worldwide.
He said Huaxin’s engineering expertise and focus on research and development would strengthen HBM Nigeria’s operations and help close engineering skills gaps in the country.
“As HBM Nigeria, we are strategically positioned for long-term competitiveness and stronger market leadership while reinforcing our commitment to supporting Nigeria’s infrastructure development and economic progress after more than six decades of industry leadership,” he said.
He also said sustainability would remain central to the company’s operations, noting that it had introduced lower-carbon products and continued to invest in environmentally friendly production processes.
By Adedapo Adesanya
The Federation Account Allocation Committee (FAAC) distributed about N2.550 trillion from the revenue generated by the nation in June 2026 to the three tiers of government after its July meeting in Abuja.
A statement signed by the Director of Press in the Office of the Accountant General of the Federation, Mr Bawa Mokwa, “The N2.550 trillion total distributable revenue comprised N1.809 trillion in distributable statutory revenue and N740.724 billion in distributable Value Added Tax (VAT) revenue.”
It was gathered that a total gross revenue of N4.500 trillion was available in June 2026, with deductions for the cost of collection amounting to N160.744 billion, and transfers and refunds at N1.789 trillion.
According to a communiqué after the gathering, gross statutory revenue of N3.700 trillion was received in June 2026, N1.049 trillion higher than the N2.651 trillion received in the preceding month, while gross revenue of N799.746 billion was generated from VAT, N56.058 billion higher than the N743.688 billion recorded in May 2026.
It was stated that from the N2.550 trillion total distributable revenue, the federal government received N923.438 billion, the state governments got N838.208 billion, while the local government councils were given N591.390 billion, with N197.610 billion allocated to the benefiting states as 13 per cent of mineral derivation revenue.
From the N1.809 trillion distributable statutory revenue, the federal government went away with N849.366 billion, states shared N430.810 billion, local councils took N332.136 billion, while the benefiting states got N197.610 billion as derivation revenue.
From the N740.724 billion distributable VAT earnings, the central government got N74.072 billion, the states received N407.398 billion, and the local government councils were allocated N259.253 billion.
The communiqué further stated that in June 2026, collections from Companies Income Tax (CIT), Capital Gains Tax (CGT), Stamp Duties (SDT), Petroleum Royalties, Gas Flare Penalties, Rent, Mineral Oil Royalties (MOR), Value Added Tax (VAT), Import Duty, and Common External Tariff (CET) Levies increased significantly, while Petroleum Profit Tax (PPT), Hydrocarbon Tax (HT), Mineral Royalties, and Fees declined considerably. Excise Duty recorded only a marginal increase.
By Adedapo Adesanya
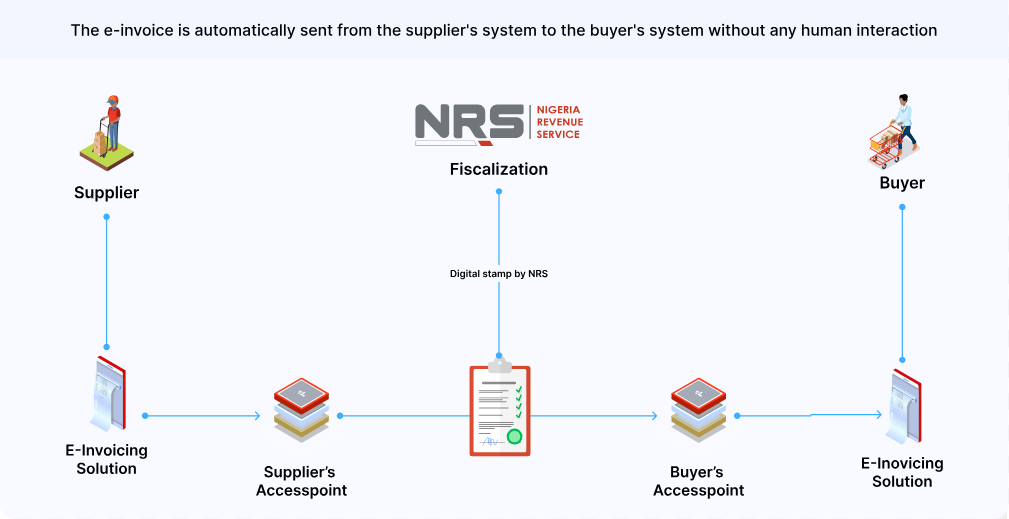
The Nigeria Revenue Service (NRS) says the rollout of electronic invoicing (e-invoicing) will strengthen tax compliance, curb revenue leakages and improve transparency in tax administration as it moves to fully digitise the country’s tax system.
The Project Lead for the NRS e-Invoicing Project, Mr Mohammed Bawa, stated this at the DigiTax E-Invoicing Compliance Breakfast Session held in Lagos on Wednesday.
The event, organised by DigiTax, an NRS-accredited e-invoicing platform, formed part of efforts to support the agency’s ongoing education and sensitisation campaign on the e-invoicing mandate.
Mr Bawa said the initiative aligns with global trends in tax digitisation and is expected to help improve Nigeria’s tax-to-GDP ratio, which remains one of the lowest in Africa.
According to him, the system will provide the NRS with greater visibility into transactions across sectors, formalise activities within the informal economy and standardise invoice formats nationwide using globally recognised invoice schemas.
He added that e-invoicing would improve operational efficiency for both businesses and tax authorities while supporting the NRS’ transition from manual and electronic tax administration processes to a fully automated system-to-system interaction model.
Mr Bawa noted that the legal framework for implementation is backed by the Nigeria Tax Administration Act, which prescribes penalties for non-compliance.
He disclosed that the NRS has completed onboarding large taxpayers and is preparing to enforce compliance with defaulting entities.
According to him, medium taxpayers are expected to begin compliance in the third quarter of 2026, while onboarding of emerging taxpayers will commence in 2027, with full adoption targeted for all taxpayers by the end of 2028.
Mr Bawa urged taxpayers yet to be onboarded onto the platform to begin the process and work with accredited service providers to ensure compliance.
On his part, Country Director of DigiTax Nigeria, Mr Olumide Akinsola, urged businesses to look beyond their internal systems and assess the compliance status of suppliers and counterparties.
He warned that businesses whose suppliers fail to transmit invoices through the MBS platform risk losing eligibility to claim Value Added Tax (VAT) input credits on such transactions, describing the resulting supply chain exposure as a significant commercial risk that many organisations have yet to quantify.
Mr Akinsola also announced the launch of DigiTax’s white paper, The State of E-Invoicing Readiness in Nigeria, which examines compliance adoption trends and the readiness gap across different taxpayer segments.
He added that DigiTax operates in Nigeria, Kenya, Zambia and the United Arab Emirates (UAE), noting that experience from those markets shows businesses that integrate early are better positioned to avoid disruptions when enforcement begins.
