Economy
Demand And Supply Zone Trading: A Comprehensive Overview From Experts
Traders Union (TU) experts know that supply and demand rules control all markets. When traders trade, they usually use technical signals to find out if there is more supply or demand. In this guide, the analysts will delve into the world of supply and demand zones and explore their significance in trading. But before you dive in, it’s crucial to grasp the fundamentals.
What you should know about supply and demand zones
The guidance from TU’s analysts provides insight into the crucial aspects of demand and supply zone trading. It is important to understand these zones:
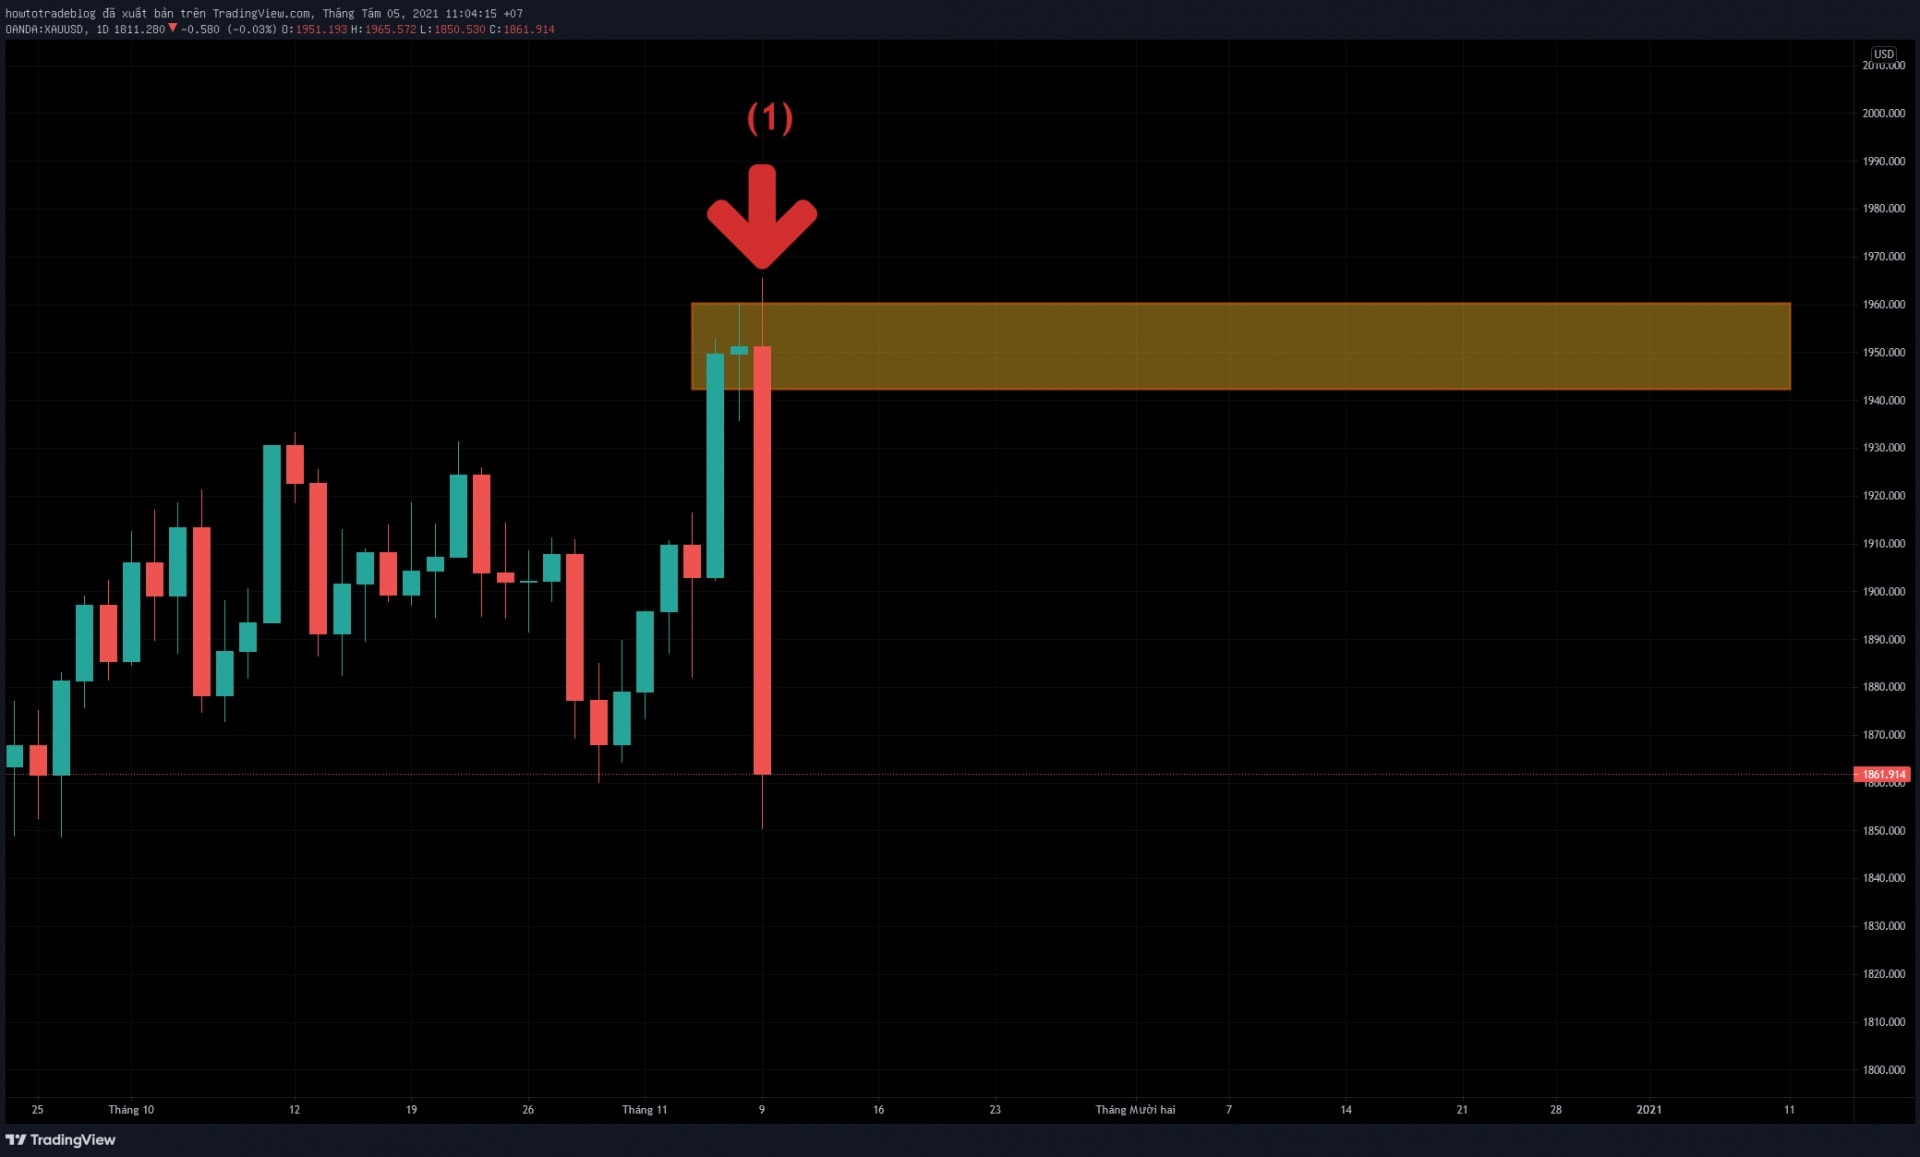
- Supply Zone – this is where traders commonly opt to sell, and it typically lies above the current price. When the price reaches a well-established supply level, it triggers the completion of unsold sell orders, frequently resulting in a downward price movement.
- Demand Zone – conversely, the demand zone serves as the go-to area for traders looking to buy. It’s situated below the current price, attracting many buyers who are prepared with purchase orders at that specific level. Recognizing a demand zone is a key skill in trading.
These insights provide a solid foundation for traders to comprehend how supply and demand zones operate in the dynamic world of trading.
Advantages & disadvantages of supply and demand trading
Let’s check out the good and not-so-good sides of these approaches, according to analysts at Traders Union.
Advantages:
- Easy to understand
Supply and demand trading is simple and makes sense. It’s about how prices are set when supply and demand meet.
- Works everywhere
This idea fits any market where stuff is bought and sold, making it a useful strategy for all traders.
- Can predict future prices
Supply and demand zones often hint at where prices might go next, helping traders make predictions.
- Clear risk and reward
These zones show when to enter, exit, and set goals, which helps manage risks and rewards.
Disadvantages:
- Not always clear
Figuring out supply and demand zones can vary between traders, making it a bit unclear sometimes.
- Might miss small moves
Sometimes, small price changes in these zones can give wrong signals, making traders enter or exit trades too early.
- Looks back in time
Supply and demand zones are based on past data, so they might not always predict future prices accurately.
- Needs patience
This method often means waiting for prices to hit the right zones, which can be tough when the market is calm.
Recommendations for beginners
Supply and demand are big deals in Forex trading. TU’s experts have five tips to help beginners like you:
- Combine with technical analysis
Just knowing supply and demand isn’t enough. You should also learn technical stuff like chart patterns and indicators. This helps you understand how the market might react to supply and demand.
- Risk management
Be smart about risks. Don’t bet too much money on one trade, usually no more than 1-2% of your total. This way, you can handle losses without emptying your account and get better over time.
- Spot big differences
Look for big differences between supply and demand. These can hint at potential trades. Find places where prices have shot up or down quickly.
- Use longer time frames
If you’re starting out, use longer charts like daily or weekly. They show the market better and aren’t as noisy as shorter ones.
- Confirm with indicators
While supply and demand are important, you can use other indicators for extra certainty. Things like volume indicators, RSI, or moving averages can back up your supply and demand ideas.
Conclusion
Understanding supply and demand is essential in the world of trading, and the Traders Union has provided valuable insights into these fundamental principles. While supply and demand trading offers simplicity, universality, predictive potential, and clear risk-reward management, it does come with challenges, including subjectivity, potential for missed signals, reliance on historical data, and the need for patience.


By Adedapo Adesanya
The NASD Over-the-Counter (OTC) Securities Exchange further declined by 0.23 per cent, with the Unlisted Security Index (NSI) down by 9.63 points on Tuesday, March 31, to 4,100.11 points from 4,109.74 points.
In the same vein, the market capitalisation went down by N5.76 billion to finish at N2.453 trillion from the N2.458 trillion it closed a day earlier.
The mood of the market was flat yesterday as there were three price losers and three price gainers, led by Central Securities Clearing System (CSCS) Plc, which gained N1.51 to sell at N78.68 per unit compared with the previous day’s N77.17 per unit. UBN Property Plc appreciated by 15 Kobo to N2.20 per share from N2.05 per share, and Geo-Fluids Plc improved by 3 Kobo to N3.25 per unit from N3.22 per unit.
On the flip side, 11 Plc lost N31.05 to close at N285.00 per share versus Monday’s closing price of N316.50 per share, FrieslandCampina Wamco Nigeria Plc dropped 95 Kobo to trade at N98.05 per unit versus N99.00 per unit, and Industrial and General Insurance (IGI) Plc went down by 2 Kobo to 52 Kobo per share from 57 Kobo per share.
During the trading day, the volume of securities jumped by 137.9 per cent to 50.8 million units from 21.3 million units, the number of deals rose 28.9 per cent to 49 deals from the preceding session’s 38 deals, while the value of securities went down by 65.2 per cent to N226.9 million from N651.1 million.
CSCS Plc remained the most traded stock by value (year-to-date) with 56.8 million units worth N3.8 billion, followed by Okitipupa Plc with 27.5 million units valued at N1.8 billion, and Infrastructure Guarantee Credit Plc with 400 million units traded for N1.2 billion.
Resourcery Plc was the most traded stock by volume (year-to-date) with 1.1 billion units sold for N415.7 million, followed by Infrastructure Guarantee Credit Plc with 400 million units transacted for N1.2 billion, and Geo-Fluids Plc with 183.0 million units exchanged for N673.8 million.
By Adedapo Adesanya
The Naira weakened against the US Dollar in the Nigerian Autonomous Foreign Exchange Market (NAFEX) on Tuesday, March 31, by 0.23 per cent or N3.14 to N1,386.72/$1 from the N1,383.58/$1 it was traded on Monday.
Similarly, the Nigerian currency depreciated against the Pound Sterling in the same market window by N14.40 to close at N1,839.34/£1 compared with the previous day’s N1,824.94/£1, and against the Euro, it lost N12.88 to settle at N1,599.16/€1 versus N1,586.28/€1.
In the same vein, the Naira stumbled against the Dollar yesterday by N1 to quote at N1,395/$1 versus N1,394/$1, and in the black market, it remained unchanged at N1,410/$1.
The Naira remains under pressure as FX liquidity shrank, as evidenced by the number of interbank FX deals published by the Central Bank of Nigeria (CBN).
Last week, forex intervention operations saw the apex bank inject $95 million into the supply side, but as high demand for the Dollar as a safe-haven asset continues, it strengthened the Dollar index, while the Euro, British Pound and other major trading partners weakened.
The country’s external reserves recorded a marginal decline, falling by 0.7 per cent to $49.48 billion, reflecting a depletion of about $350 million and signalling continued pressure on Nigeria’s FX buffer.
In the cryptocurrency market, reports of comments by Iran’s President Masoud Pezeshkian hinted at eased geopolitical tensions, which triggered gains across some assets.
Mr Pezeshkian reportedly signalled Iran would be willing to end the conflict in exchange for security guarantees, raising hopes for a diplomatic off-ramp and reducing fears of a wider regional war.
Ethereum (ETH) gained 4.4 per cent to trade at $2,150.11, Ripple (XRP) jumped 2.8 per cent to $1.36, Bitcoin (BTC) added 2.5 per cent to sell at $69,079.14, Cardano (ADA) which also rose by 2.5 per cent to $0.2518, Dogecoin (DOGE) improved by 2.4 per cent to $0.0941, Solana (SOL) grew by 1.3 per cent to $84.43, and Binance Coin (BNB) increased by 1.2 per cent to $618.86, while TRON (TRX) dipped 1.8 per cent to $0.3153, with the US Dollar Tether (USDT) and the US Dollar Coin (USDC) flat at $1.00 apiece.

By Adedapo Adesanya
The oil market was down more than $3 on Tuesday following reports that Iran’s president said the country was ready to end the war that has affected the global markets.
Brent crude depreciated by $3.42 to $103.97 per barrel, while the US West Texas Intermediate (WTI) crude lost $1.50 or 1.46 per cent to trade at $101.38 per barrel.
For Brent, it has steadily risen over the last four weeks as the Iran war has escalated, with attacks across energy infrastructure throughout the Gulf that have resulted in the worst-ever oil-and-gas supply disruption.
However, on Tuesday, Iran’s president, Mr Masoud Pezeshkian, suggested the Islamic Republic is open to ending the war if certain conditions are met.
“We possess the necessary will to end this conflict, provided that essential conditions are met, especially the guarantees required to prevent repetition of the aggression,” Mr Pezeshkian said in a phone conversation with the president of the European Council, according to a statement from his office.
The comments followed that of US Secretary of Defence Pete Hegseth, who said that the next days of the Iran war will be “decisive” while refusing to rule out US ground forces playing a role in the conflict.
In March, the market moved up and down each time US President Donald Trump suggested the military operation may be de-escalated – only to resume its upward path due to the supply impairment caused by Iran’s threats against vessels transiting the key Strait of Hormuz, the artery used to ship one-fifth of the world’s oil and gas.
Iran’s Islamic Revolutionary Guard Corps (IRGC) is only allowing vessels flying flags of “friendly” countries to transit, as traffic through the Strait of Hormuz has collapsed from more than 100 ships transiting every day to fewer than 10 per day, most of which are with critical supplies bound for China, India, and Pakistan.
President Trump has suggested other countries should intervene to open the strait, a move European nations have not wanted to take until hostilities cease.
Meanwhile, the US has removed sanctions on barrels from Russia and pledged reserve releases with a group of other nations, but those measures will only offset the supply loss for a limited period of time.
The American Petroleum Institute (API) estimated that crude oil inventories in the US rose by a staggering 10.263 million barrels in the week ending March 27. Official data from the US Energy Information Administration (EIA) will be released later on Wednesday.


-
 Feature/OPED6 years ago
Davos was Different this year
-
Travel/Tourism10 years ago
Lagos Seals Western Lodge Hotel In Ikorodu
-

 Showbiz3 years ago
Estranged Lover Releases Videos of Empress Njamah Bathing
-
 Banking8 years ago
Sort Codes of GTBank Branches in Nigeria
-

 Economy3 years ago
Subsidy Removal: CNG at N130 Per Litre Cheaper Than Petrol—IPMAN
-

 Banking3 years ago
Sort Codes of UBA Branches in Nigeria
-

 Banking3 years ago
First Bank Announces Planned Downtime
-

 Sports3 years ago
Highest Paid Nigerian Footballer – How Much Do Nigerian Footballers Earn