
Economy
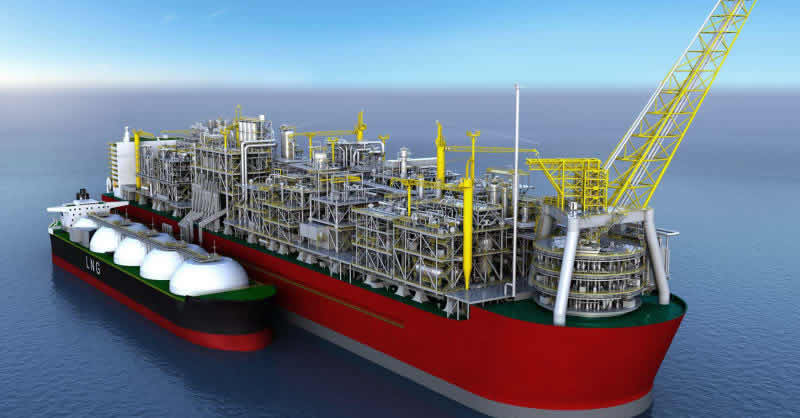
Nigeria Rakes N7.68trn Exporting Gas Products in 2024
By Adedapo Adesanya
Nigeria earned N7.68 trillion from the export of natural gas, liquefied petroleum gas and other gas products in 2024.
This showed an increase of 105.1 per cent from the N3.746 trillion earned from the sale of the commodities in 2023, data from the National Bureau of Statistics (NBS) in its Foreign Trade Statistics for the Fourth Quarter of 2024 noted.
It was revealed that gas export earnings accounted for 9.92 per cent of total exports recorded in the year under review versus the 10.42 per cent posted a year earlier.
Giving a breakdown of gas exports in 2024, the NBS reported that in the first quarter, the country recorded N1.437 trillion, N2.881 trillion was earned in the second quarter, while in the third and fourth quarter of 2024 stood at N35.845 billion and N3.329 trillion, respectively.
In comparison, the NBS stated that the country earned N668.119 billion, N711.1 billion, N1.109 trillion and N1.257 trillion from gas exports in the first, second, third and fourth quarter of 2023, respectively.
The NBS noted that the during the period under review, the country earned N1.943 trillion from natural gas exports, followed by other petroleum gases with N1.117 trillion, while Liquefied Petroleum Gas (LPG) trailed with N269.074 billion.
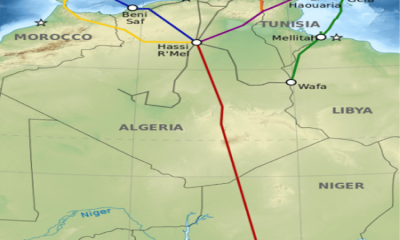
The agency disclosed that Nigeria exported Liquefied Petroleum Gas valued at N112.71 billion and Natural gas worth N83.655 billion to the Netherlands in the fourth quarter of 2024; while natural gas valued at N135.21 billion was exported to France.
It added that Spain purchased N345.118 billion worth of natural gas from Nigeria and N131.289 billion worth of other petroleum gas, while India purchased other petroleum gas and natural gas valued at N337.085 billion and N209.159 billion, respectively.
In Africa, the NBS noted that Nigeria sold N10.81 billion worth of Liquefied Petroleum Gas to the Ivory Coast in the fourth quarter of 2024.
Based on the entire data, the stats office disclosed that total foreign trade stood at N138.033 trillion in 2024; rising by 106.6 per cent, compared with N66.825 trillion in 2023.
It added that total exports stood at N77.442 trillion in 2024, rising by 115.3 per cent compared with N35.962 trillion in 2023; while total imports stood at N60.59 trillion in 2024, rising by 96.3 per cent from N30.863 trillion recorded in 2023.


By Aduragbemi Omiyale
Leading manufacturer of personal healthcare products and consumer goods, PZ Cussons Plc, recorded a 22 per cent growth in its revenue in the 2026 fiscal year.
In its unaudited results recently submitted to the Nigerian Exchange (NGX) Limited, the company posted revenue of N260.46 billion in the period under review compared with the N212.63 billion achieved in the corresponding period in 2025.
This revenue growth was buoyed by market share gains for its major brands, increased household penetration and robust volume uplift, according to the chief executive of PZ Cussons, Mr Oghale Elueni.
It was observed that the cost of sales as a percentage of revenue was 72 per cent, 100bps lower than the prior year, driven by better mix and supply efficiencies.
Marketing and distribution expenses increased by 48.2 per cent to N26.51 billion from N17.89 billion, and administrative expenses also spiked by 43 per cent to N21.07 billion from N14.70 billion.
Also, the organisation recorded significant profitability for the year ended May 31, 2026, rising by 388 per cent to N49.10 billion from N10.07 billion.
Mr Elueni attributed this strong performance to the strength of the business, the equity of the brands, and the discipline of execution, noting that despite the complex and consistently challenging operating environment, the company pulled through to deliver growth in both revenue and profit.
He disclosed that the 22 per cent revenue growth recorded for the 2026 financial year was influenced by a healthy mix of volume and price initiatives.
“The balance sheet was further de-leveraged and strengthened through a cash-accretive P&L and efficient working capital management. The impact has been an improvement in the net asset position from N17.3 billion negative at the beginning of the year to N70.6 billion at year-end.
“The business grew volumes in both the electrical and consumer business, leveraging investment in our brands and sharpening our go-to-market capabilities. The result has been market share gains for our major brands, increased household penetration and robust volume uplift, contributing to overall revenue growth,” he stated.
Mr Elueni expressed profound appreciation to the shareholders for their unwavering support in navigating through the challenges in the last 12 months, noting that the board remains confident that, despite geopolitical uncertainties and their attendant economic shocks, the business is sufficiently resourced to deliver value to stakeholders.
“We have a business that has strong brands, an adaptive operating framework and a culture of disciplined execution that supports the consistent delivery of value to stakeholders,” he stated.
By Adedapo Adesanya
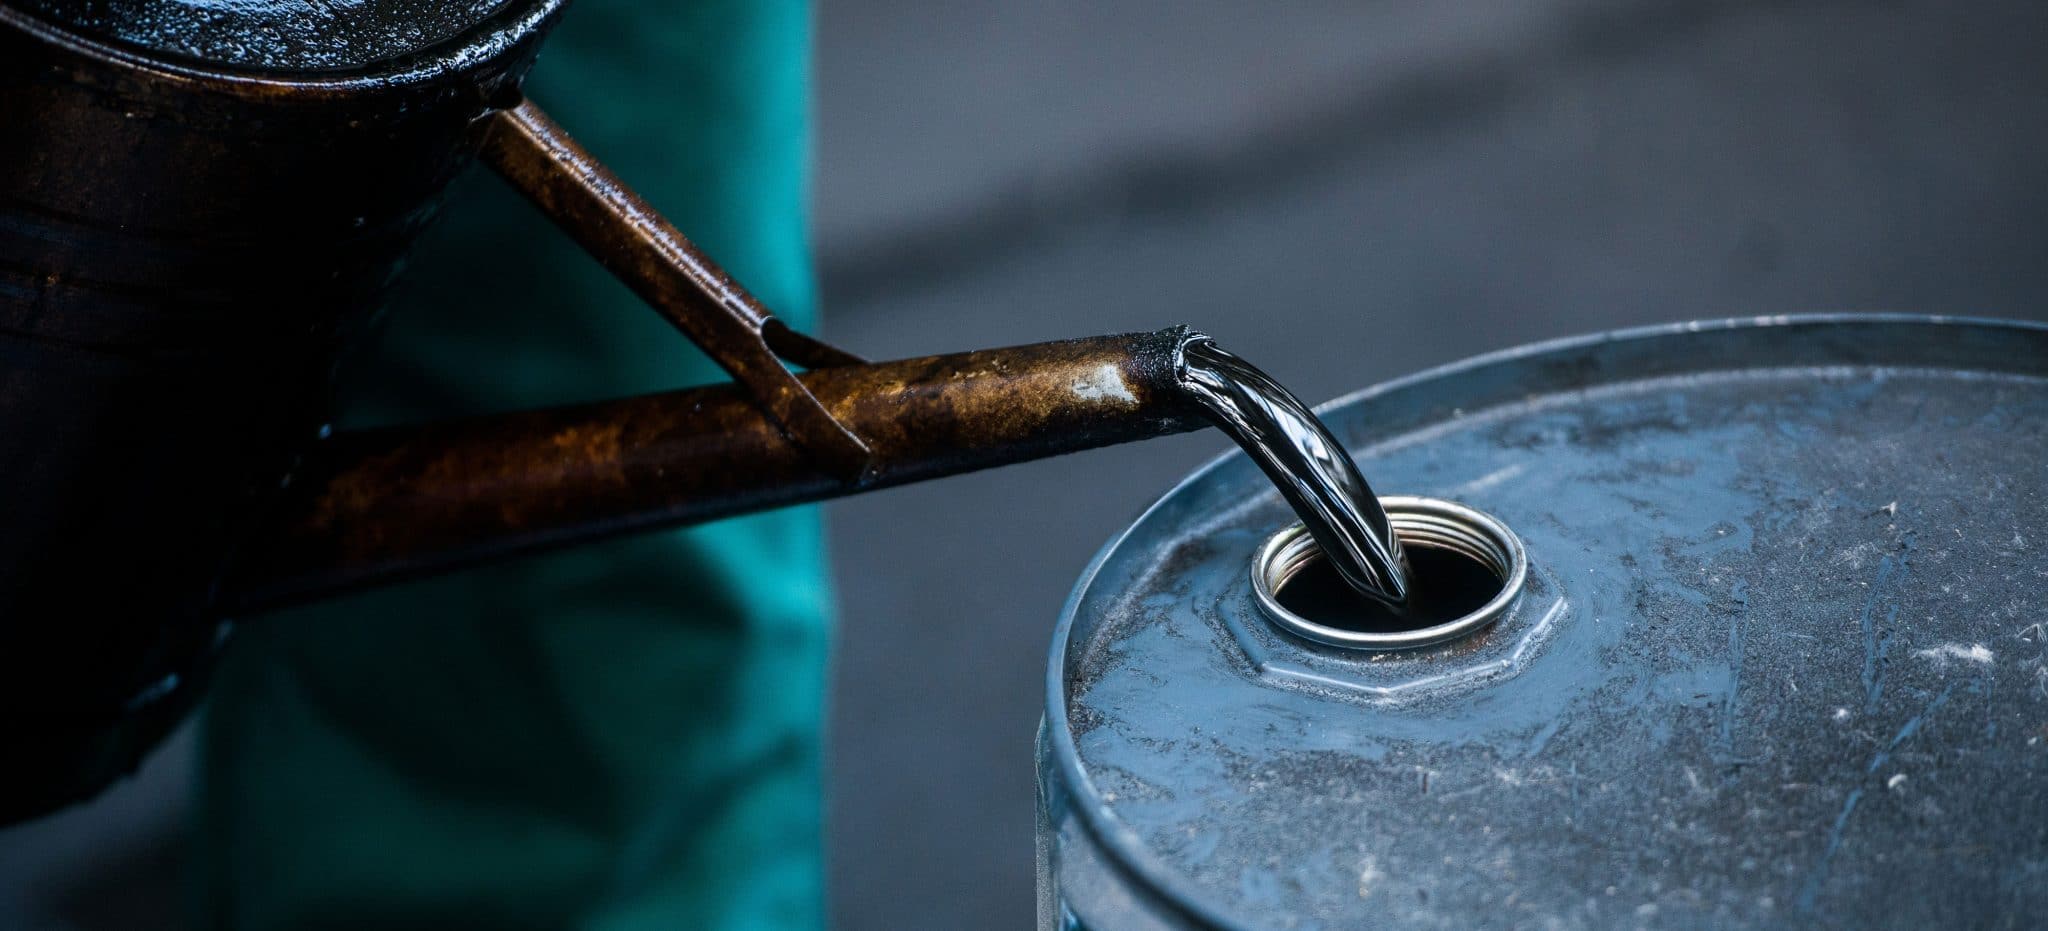
Nigeria’s crude oil production increased in May and June, according to data published by the Organisation of the Petroleum Exporting Countries (OPEC).
The country’s output increased by 42,000 barrels per day to 1,530 million barrels in May, from 1,489 million barrels in April.
According to Reuters, Nigeria, whose shipments were not affected by the Iran war, also pumped more in June, based on flow data from financial group LSEG, information from other companies that track flows, such as Kpler, and data provided by sources at oil companies, OPEC, and consultants.
Output from the OPEC rose by 2.34 million barrels a day to 18.75 million a day, with the gains driven by Kuwait, Saudi Arabia and Iran, the survey showed. The rebound still leaves production considerably below prewar levels.
Kuwait posted the biggest increase among OPEC’s 11 members last month, boosting output by 870,000 barrels a day to 1.36 million a day followed by Saudi Arabia, which raised output by 550,000 barrels a day to an average of 7.2 million a day. That was followed by Iran, which hiked by 510,000 a day to pump 2.85 million a day, and has accumulated a hoard of supply on tankers at sea as it struggles to find buyers.
In the wider alliance, Russia has bolstered crude exports to record levels following Ukrainian strikes on its refineries, potentially diverting volumes that can’t be processed at home.
Even before the peace deal, Persian Gulf producers had found ways to sneak cargoes out through the strait, which was largely shuttered in the early stages of the conflict.
The uptick in supply is creating a surplus in parts of the market, erasing crude’s wartime rally and raising the question of whether OPEC nations will need to compete for customers.
The group’s June production was still 7.3 million barrels a day, or 28 per cent, below February levels, when adjusted for exit by the United Arab Emirates (UAE).
The UAE quit OPEC in May, giving it the freedom to pump at will once the strait fully stabilises. Iraq also briefly threatened it could exit unless eventually given a higher output quota by the organisation.
On Sunday, a subgroup of seven OPEC+ nations announced a 188,000 barrels a day boost in August continuing the series of small and symbolic production hikes during the war to continue a process of restoring output halted a few years ago.
By Adedapo Adesanya
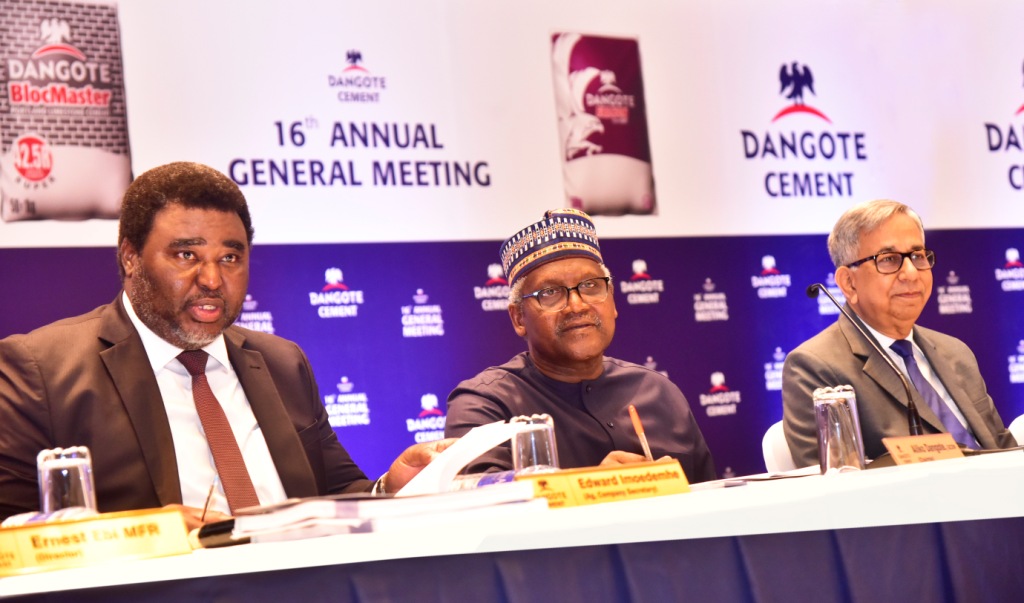
Shareholders of Dangote Cement Plc have approved plans that could pave the way for the company’s secondary listing on the London Stock Exchange (LSE) while also endorsing a final dividend of N45.00 per ordinary share for the 2025 financial year.
The resolutions were passed at the company’s 17th Annual General Meeting (AGM) held on Thursday at Eko Hotels & Suites in Lagos, where shareholders also approved the audited financial statements for the year ended December 31, 2025.
The approval for an international secondary listing marks a significant step in Dangote Cement’s plans to broaden its access to global capital markets and enhance its international investor base.
In May, the company’s founder Mr Aliko Dangote said the cement subsidiary was planning a London listing to sell 10 per cent stake, sixteen years after debuting on the Nigerian Exchange (NGX) Limited. This would provide the company with the much-needed boost to compete in the United Kingdom market.
Shareholders also ratified the payment of a final dividend of N45.00 per ordinary share from the company’s retained earnings as of December 31, 2025. The dividend was paid on Thursday, July 2, 2026.
At the meeting, shareholders approved the appointment of Ms Mariya Aliko-Dangote to the company’s board of directors. In recent months, the eldest daughter of the billionaire as well as her sisters Halima and Fatima, have been strategically positioned across their father’s empire in what has been touted as succession plans.
They also re-elected four directors retiring by rotation: Mr Emmanuel Ikazoboh, an Independent Non-Executive Director; Mr Olakunle Alake, a Non-Executive Director; Ms Berlina Moroole, a Non-Executive Director; and Mr Alvaro Poncioni Merian, an Independent Non-Executive Director.
In addition, shareholders authorised the board to determine the remuneration of the company’s external auditors for the 2026 financial year.
The AGM also noted the disclosure of managers’ remuneration in compliance with the provisions of the Companies and Allied Matters Act (CAMA) 2020.
Shareholders further approved the election of Mr Robert Ade-Odiachi, Mr Sheriff Yussuf Mojirola and Mr Nicholas Nyamali as shareholders’ representatives on the Statutory Audit Committee. They will serve alongside the company’s representatives, Mr Ernest Ebi and Mr Olakunle Alake, until the next AGM.
They also approved annual remuneration of N20 million for the chairman and N15 million each for the non-executive directors for the financial year ending December 31, 2026.

-
 Feature/OPED6 years ago
Davos was Different this year
-
Travel/Tourism10 years ago
Lagos Seals Western Lodge Hotel In Ikorodu
-

 Showbiz4 years ago
Estranged Lover Releases Videos of Empress Njamah Bathing
-
 Banking8 years ago
Sort Codes of GTBank Branches in Nigeria
-
 Economy3 years ago
Subsidy Removal: CNG at N130 Per Litre Cheaper Than Petrol—IPMAN
-
 Banking3 years ago
Sort Codes of UBA Branches in Nigeria
-

 Banking3 years ago
First Bank Announces Planned Downtime
-

 Sports3 years ago
Highest Paid Nigerian Footballer – How Much Do Nigerian Footballers Earn