
Economy
NSE 2016 Market Recap and Outlook for 2017

By Dipo Olowookere
2016 Global Economic Summary
The global economy remained sluggish in 2016 with a forecast of 3.1% in global GDP growth according to the International Monetary Fund (IMF), compared to 3.4% originally projected, and 3.2%1 achieved in 2015.
Uncertainty took centre stage during the year, as global economies grappled with unpredictable geopolitical developments, ranging from Brexit referendum in June to the result of US presidential elections in November.
The vast disparity between forecasted outcomes and actual results left several emerging and frontier economies, and their respective capital markets, in peril as the movement of international capital stalled in anticipation of global policy direction.
This was also compounded by the continued decline in global commodity prices, with crude dropping below the $30/barrel mark (the lowest level in 12 years), intrinsically creating hardships for commodity dependent countries like Venezuela, Russia and Nigeria (with their impact on foreign reserves being primarily negative).
Recapping on the year 2016, the global landscape was primarily shaped by some of the following factors:
- The anticipated impact the UK’s “Yes” vote would have on Europe’s 2nd largest economy;
- China’s shift towards growing its middle class via organic economic growth, restructuring the economy away from resource import dependency, towards a resource investment strategy;
- Election of US President-Elect Donald Trump and uncertainty around national policy direction (i.e. global trade implications of nationalism, immigration reforms, etc.);
- Continued geopolitical tension in the Middle East (i.e. continued Syrian turmoil, ISIS insurgence) and other hot spots; and
- Reemergence of the US Federal Reserve rate hike as a policy tool to curb economic overheating.

According to the IMF, growth in Emerging Market and Developing Economies is projected to edge up to 4.2% in 2016, 0.2 percentage points higher than the previous year.
This projection, however, represents mixed expectations for economies within the region. Robust growth in EMD Asian economies like India and strong recovery in the MENAP and CIS regions were offset by economic stagnation in areas like Latin America, the EMD EU, China and SSA.
In SSA, growth in 2016 is expected to fall to 1.4% from 3.4% in 2015, primarily due to weak growth in its three largest economies, being Nigeria, South Africa and Angola, as they struggle to adjust to the “new oil order”, while attempting to rectify structural deficiencies in their respective economies.
In the case of Nigeria, despite a challenging economic environment in 2016, the country remains the economic powerhouse of Africa with an expected GDP of $415.08B
Global Capital Market Recap
Global capital markets experienced their slowest start to the year in over a decade in 2016, as the World Federation of Exchanges (WFE) reported that value traded in cash equity markets declined by 24% in H1’2016.
However, pre-election volatility gave way to post-election enthusiasm as advanced economies saw their capital markets rally in anticipation of stronger growth in the US buoyed by tax reforms and expansionary fiscal policies proposed by the Trump transition team.
By Q4’16, advanced capital markets had picked up significant momentum, with major indexes such as the Dow Jones Industrial Average Index reaching record highs. Amid signs of a US recovery, the US Federal Reserve (the Fed) raised rates by 0.25% in its final meeting of the year.
However, there was a contra-impact in Emerging and Developing Markets, as global investors shifted capital flows back to advanced economies in search of low price and low risk assets with increasing yields.
According to the Wall Street Journal, “Global investors’ appetite for emerging-market stocks and bonds slumped to its lowest level since the global financial crisis last year (2016), with the biggest hit to inflows coming after Donald Trump’s victory in the U.S. presidential election”.
Accordingly, “foreign investors sent just $28 billion into emerging markets in 2016…90% lower than the average from 2010 to 2014”.
NSE Capital Market Recap
The bottoming out of crude oil prices and a drastic decline in domestic oil output curtailed crude oil export proceeds, which accounts for roughly 90% and 70% of Nigeria’s FX earnings and government revenue respectively.
This resulted in foreign exchange liquidity challenges during the year, as the supply side of FX into the Central Bank of Nigeria (CBN) dropped by over 70%4 , despite heavy domestic demand. Accordingly, the oil price shocks and associated prolonged FX dilemma, coupled with challenges to policy implementation, drove the Nigerian economy into its first recession in over twenty (20) years by Q2’16.
Capital markets tend to act as barometers of any economy, and in Nigeria’s case, the prolonged economic downturn directly impacted an array of products and asset classes on the Nigerian Stock Exchange (NSE or The Exchange).
The NSE Industrial Index recorded the steepest drop of the year at 26.37%, a result of severe difficulties faced by companies in accessing capital for imported raw materials. In the Exchange Traded Funds (ETFs) market, tracking to this methodology, the Vetiva Industrial ETF recorded the largest price decline in 2016 of 20.51% when compared to ETFs in other sectors.
On the flip side, the NSE’s NewGold ETF saw a sharp increase, as its value climbed 94.73% during the year, a clear indication of investor’s flight to safety sentiments.
Generally, we saw 19.41% increase in ETF AUM listed on The Exchange from 2015 to 2016, primarily due to the listing of the Vetiva S&P Nigerian Sovereign Bond ETF.
Further indication of the equity market’s link to economic dynamics is reflected in the drop in NSE Oil/Gas Index which declined 12.31%, mimicking the 22.01%5 decline in real GDP growth of the oil sector by Q3’16 driven by output and distribution complications.
Real Estate Investment Trusts (REITs) declined by 49.48% and 47.10% in value and volume traded, respectively, reflecting the macro-economic impact of the real estate sector which declined by 7.37%5 in terms of GDP.
Inflation had a converse-effect on activity in the fixed income market during the year. Inflation spiked above 18% by Q4’16, driven by rising prices of imports and structural deficiencies in power, transportation, and production.
The high rate of inflation forced the CBN to raise interest rates to 14% in July 2016. Consequently, the value of bonds in the market depreciated, increasing investors’ appetite for portfolio diversification via interest rate products selling at discounts.
This resulted in a 137% increase in the value of bonds traded on the NSE in 2016, admittedly from a low base. We also saw a 31.17% improvement in bond issuance during the year.

After peaking at 31,071.25 in June 2016, an increase of 8.48% over the 2015 closing value, the NSE All Share Index (NSE ASI) began to retreat to negative territory as total foreign inflow dropped 45% between June (N42.46Bn) and July (N23.43Bn) due to i) loss of confidence in the implementation of an announced free floating FX regime; ii) weak corporate performance; and iii) 2 nd consecutive quarter of negative economic growth in the period resulting in the economy entering into a recession.
Accordingly, we witnessed the lowest levels of foreign portfolio and domestic trading activity post the global financial crisis, with a Y-O-Y decline of 69.79% and 56.79%6 respectively.
This trend is consistent with the inverse correlation observed between the value traded on the NSE’s equity market and the spread between the parallel and interbank FX market rates (see Chart 4), suggesting that both domestic and foreign investors seek stability in monetary policy.
In addition to sluggish performance in secondary markets, primary market activity was nonexistent as there were no IPOs for the year, although there was one (1) new company listed by introduction7 in the period.

However, the Nigerian capital market did experience some resilience by year-end as the NSE Premium Board Index ended 2016 in positive territory, advancing 6.98%, while the NSE Banking Index inched up by 2.17%.
Furthermore, after declining by 21.60% to a low of 22,456.32 in Q1’16, the NSE ASI rebounded by 19.68% from its January low to close the year down by 6.17% mirroring the 6.12% decline in the equity market capitalization (approx. 40%8 in USD terms).

NSE Strategy Execution in 2016
Building on the successes achieved in 2015, the NSE remained steadfast in the execution of its strategy despite the challenging environment. We also ramped up our engagement with Government at various levels to advocate for market friendly policies and initiatives that can drive economic recovery. Highlighted below are milestones achieved in 2016:
Business Development
- Demutualization: Concluded due diligence process, established member relations desk and credible member register, and developed a roadmap to demutualization. We have had several engagements with key stakeholder groups (eg: Exchange members, SEC, NASS, CAC, etc.).
- Derivatives: Established corporate vehicle for a Central Counterparty clearing house (CCP), engaged legal and financial advisers to support launch of the CCP, and engaged extensively with key stakeholder groups (NASS, CBN, SEC, CSCS, Bankers’ Committee, Dealing members, etc.), and started derivatives product development.
- Monetization of Market Services Suite: Launched thirteen (13) new products and implemented the first market data conference in Nigeria, with additional plans to onboard first set of clients for the regulatory consulting services business.
- Competitive Price Structure: A pilot fee structure for fixed income products was launched and the development of a market wide framework has reached an advanced stage.
Domestic/ Foreign Investor Drive
- Product Launch: Launched a Vetiva S&P Nigerian Sovereign Bond ETF.
- Workshop Events: World-class workshops for fixed income, ETFs and market data products.
- Stakeholder Engagement Events: Held a number of key stakeholder events including two (2) NSE/LSE dual listings conferences in Lagos and London with key policymakers in attendance; CEO roundtable in collaboration with Bloomberg; and Nigerian Capital Market Information Security Forum.
- International Events: Hosted the Building African Financial Markets (BAFM) capacity building seminar held outside South Africa for the first time; the Nigerian capital market sustainability seminar in partnership with the Global Reporting Initiative (GRI) and Ernst and Young (EY); and the International Executive Development Program (IEDP).
Investor Protection
- SMARTs Technology: Launched SMARTs solution for efficient/effective market surveillance.
- Minimum Operating Standards (MOS): 94% of Dealing Member firms achieved NSE’s MOS.
- Investor Protection Fund: 83 claims valued at N27.8Mn approved for payment in 2016.
- Compliance Status Indicator (CSI): Launched CSI symbols for near real-time tracking of compliance status of listed companies.
- Corporate Governance Rating System (CGRS): Rolled out CGRS to all listed companies.
- Direct Cash Settlement (DCS): Played key role in implementation of DCS for the market.
Corporate Citizenship
- Essay Competition: 7,400 entries from over 250 schools and over N3.2Mn won in prizes.
- Global Money Week: Reached 2,433 students from 24 secondary schools.
- Corporate Challenge: Held the third edition with over 700 participants and N30.5Mn raised.
- NSE Employee Volunteering Scheme & Give-Back: In its 2nd year, employees donated time and resources to upgrade Wesley School for the hearing impaired children, and other charities across the country.
- International Women’s Day: Symposium held with the Deputy Governor, Lagos State, Mrs Idiat Adebule.
- Financial Literacy Tour: Reached 15,413 beneficiaries (7,456 students) through 151 programs.
Awards and Recognition
In recognition of the NSE’s continued thrust to enhance the investor experience and transcend the dynamics of the Nigerian market, The Exchange received a number of key awards and recognitions during the year 2016.

2017 Outlook
Global Economic Outlook
Global economic growth is projected to reach 3.4% in 2017 according to the IMF, while Goldman Sachs’s chief economist puts this estimate at a range of 3.0% to 3.5%. Accordingly, all estimates suggest that there will be positive global growth in 2017.
From the NSE’s perspective, we believe there are specific factors that will determine the pace of global economic activity in the coming year. These include: 1) political developments in the West under the emerging “new world order”, as populist sentiment towards nationalism and protectionist economic policies take effect on global trade and immigration; 2) pace of global fiscal and monetary policy implementation; 3) oil price averaging $55 per barrel as forecasted by the World Bank following the decision of OPEC to limit output and a subsequent improvement in the outlook for commodity exporters; and 4) continued growth in Asia’s largest economies (i.e. China, India, Japan, etc.) and recovery of other emerging and developing economies (i.e. SSA).

Nigerian Capital Market Outlook
Nigeria is expected to recover from its recession in 2017 with a modest GDP growth forecast of 0.6%9 driven by: i) vigor of fiscal policy implementation, with a keen focus on articulation of desired goals; ii) lower rates of disruptions to oil infrastructure from resolution of the Niger Delta conflict, thereby increasing FX inflows; iii) crude oil prices remaining above the FGN’s benchmark of $42.5/barrel; iv) positive impact of the war against corruption manifested in ease of doing business improvement; and v) policies aimed at boosting economic productivity (ex: improved budgetary allocation to capital expenditures, exit from JV Cash Call arrangements with IOCs by the FGN, which is expected to save the country $2Bn annually, etc.).
Notwithstanding the forgoing, the Nigerian capital market will have to do a better job at promoting its unique value proposition to both global and domestic investors. Monetary policy will continue to play a vital role in determining activity in the market.
With forecasts for inflation expected to moderate due to the base effect, we believe that all things equal, monetary authorities will have more flexibility with respect to interest rates and FX regime. Hence good coordination between fiscal and monetary policy should result in resolution of aforementioned structural deficiencies and drive economic growth.
We expect investors to continue to keep a close eye on the divergence between the interbank FX rate and other exchange rates in the country. Accordingly, a convergence of FX rates in the country and the performance of listed corporates will determine the level of market activity in the short term.
NSE Strategic Outlook
Cognizant of the ever evolving economic realities on ground, the NSE will take an adaptive approach to strategy execution in 2017. In the immediate future, the NSE will focus on achieving its goal of becoming a more agile and demutualized exchange and will fast track efforts towards developing innovative products such as exchange traded derivatives to provide investors with tools to better weather economic realities in 2017.
We intend to strengthen our thought leadership efforts with policymakers to drive policies that will free up the system and promote the ease of doing business in Nigeria. We believe that i) incentive schemes for sectors of the economy that can support a pivot to export led economy will be beneficial, and ii) systematic removal of impediments to doing business and therefore reduction of leakages will attract private sector investments.
From a capital market liquidity standpoint, we will enhance our cross-border integration efforts via African Securities Exchange Association’s (ASEA) African Exchange Linkage Project (AELP) model and the West African Capital Market Integration (WACMI) program. We will also continue our engagement efforts with the Government to promote the listing of privatized state owned entities (SOEs), as well as engage with the Private sector issuers for listings across all of our product categories.
We anticipate that secondary market activity will be challenged initially as the impact of various policy measures work their way through the system. However, we expect to see a revival of supplementary listings, return of the new issuance market, and potentially one IPO since the equity market is a forward indicator of the economy. We are cautiously optimistic, as consensus estimates suggest a moderate recovery for Nigeria in 2017, provided that policy makers implement the right combination of policy measures.


By Adedapo Adesanya
The chief executive of HBM Nigeria Plc (formerly Lafarge Africa), Mr Lolu Alade-Akinyemi, said the cement producer is expected to add 4.5 million tonnes to its production capacity by January 2027.
HBM Nigeria Plc is positioning itself for stronger long-term competitiveness, market leadership and job creation as it accelerates expansion projects.
The transition to HBM Nigeria marks a new phase of growth, driven by operational excellence, sustainability, innovation, and infrastructure development, while maintaining its long-standing commitment to Nigeria’s construction sector.
Mr Alade-Akinyemi, speaking recently in Lagos, said the ongoing expansion of the company’s Ashaka and Sagamu plants would significantly boost local production, create employment opportunities, and support businesses across its value chain.
“We recently announced the expansion of the Sagamu plant in Ogun State and the Ashaka plant in Gombe State. Hopefully, in January 2027, we will commission both plants, adding 4.5 million tonnes to our capacity. Traditionally, building a new plant takes about three years, but this is one of the benefits of belonging to the Huaxin Group,” he said.
According to him, the projects will generate employment, create opportunities for young people and women, strengthen local suppliers and contractors, and contribute further to Nigeria’s economic growth.
“There are many vacancies we are trying to fill in Sagamu and Ashaka. Beyond direct employment, we are creating opportunities for small businesses, developing suppliers and supporting local contractors. This is an exciting period because it will deliver significant benefits to Nigeria,” he said.
Mr Alade-Akinyemi noted that while the company’s corporate identity had changed following its acquisition by Huaxin Building Materials Group, its core values and commitment to customers, host communities, employees and shareholders remain unchanged.
He said HBM Nigeria traces its roots to 1959 as West African Portland Cement Company (WAPCO), with its first cement plant commencing operations in Ewekoro, Ogun State, in 1961.
Since then, he said, the company has grown into one of Nigeria’s leading building solutions providers with integrated plants in Ewekoro, Sagamu, Ashaka and Mfamosing.
He added that the company, which became publicly listed in 1979, has continued to expand through acquisitions and transformation while maintaining high product quality, innovation and responsible operations.
Highlighting the strengths of its parent company, Alade-Akinyemi described Huaxin Building Materials as a globally recognised building materials manufacturer founded in 1907 and headquartered in Wuhan, China, with operations across 16 regions in China and 14 countries worldwide.
He said Huaxin’s engineering expertise and focus on research and development would strengthen HBM Nigeria’s operations and help close engineering skills gaps in the country.
“As HBM Nigeria, we are strategically positioned for long-term competitiveness and stronger market leadership while reinforcing our commitment to supporting Nigeria’s infrastructure development and economic progress after more than six decades of industry leadership,” he said.
He also said sustainability would remain central to the company’s operations, noting that it had introduced lower-carbon products and continued to invest in environmentally friendly production processes.
By Adedapo Adesanya
The Federation Account Allocation Committee (FAAC) distributed about N2.550 trillion from the revenue generated by the nation in June 2026 to the three tiers of government after its July meeting in Abuja.
A statement signed by the Director of Press in the Office of the Accountant General of the Federation, Mr Bawa Mokwa, “The N2.550 trillion total distributable revenue comprised N1.809 trillion in distributable statutory revenue and N740.724 billion in distributable Value Added Tax (VAT) revenue.”
It was gathered that a total gross revenue of N4.500 trillion was available in June 2026, with deductions for the cost of collection amounting to N160.744 billion, and transfers and refunds at N1.789 trillion.
According to a communiqué after the gathering, gross statutory revenue of N3.700 trillion was received in June 2026, N1.049 trillion higher than the N2.651 trillion received in the preceding month, while gross revenue of N799.746 billion was generated from VAT, N56.058 billion higher than the N743.688 billion recorded in May 2026.
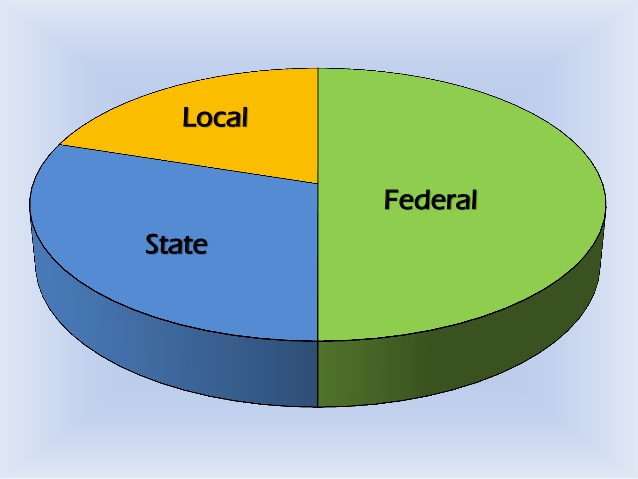
It was stated that from the N2.550 trillion total distributable revenue, the federal government received N923.438 billion, the state governments got N838.208 billion, while the local government councils were given N591.390 billion, with N197.610 billion allocated to the benefiting states as 13 per cent of mineral derivation revenue.
From the N1.809 trillion distributable statutory revenue, the federal government went away with N849.366 billion, states shared N430.810 billion, local councils took N332.136 billion, while the benefiting states got N197.610 billion as derivation revenue.
From the N740.724 billion distributable VAT earnings, the central government got N74.072 billion, the states received N407.398 billion, and the local government councils were allocated N259.253 billion.
The communiqué further stated that in June 2026, collections from Companies Income Tax (CIT), Capital Gains Tax (CGT), Stamp Duties (SDT), Petroleum Royalties, Gas Flare Penalties, Rent, Mineral Oil Royalties (MOR), Value Added Tax (VAT), Import Duty, and Common External Tariff (CET) Levies increased significantly, while Petroleum Profit Tax (PPT), Hydrocarbon Tax (HT), Mineral Royalties, and Fees declined considerably. Excise Duty recorded only a marginal increase.
By Adedapo Adesanya
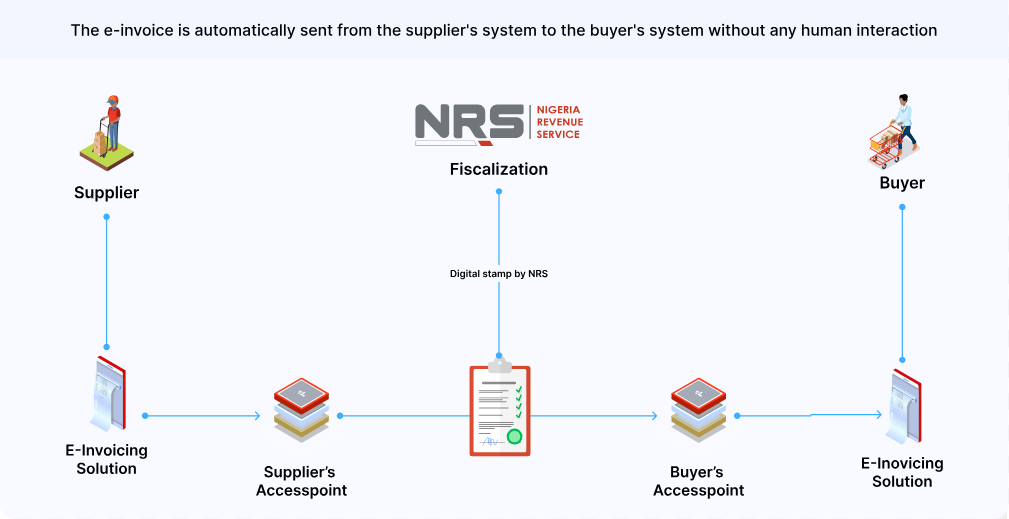
The Nigeria Revenue Service (NRS) says the rollout of electronic invoicing (e-invoicing) will strengthen tax compliance, curb revenue leakages and improve transparency in tax administration as it moves to fully digitise the country’s tax system.
The Project Lead for the NRS e-Invoicing Project, Mr Mohammed Bawa, stated this at the DigiTax E-Invoicing Compliance Breakfast Session held in Lagos on Wednesday.
The event, organised by DigiTax, an NRS-accredited e-invoicing platform, formed part of efforts to support the agency’s ongoing education and sensitisation campaign on the e-invoicing mandate.
Mr Bawa said the initiative aligns with global trends in tax digitisation and is expected to help improve Nigeria’s tax-to-GDP ratio, which remains one of the lowest in Africa.
According to him, the system will provide the NRS with greater visibility into transactions across sectors, formalise activities within the informal economy and standardise invoice formats nationwide using globally recognised invoice schemas.
He added that e-invoicing would improve operational efficiency for both businesses and tax authorities while supporting the NRS’ transition from manual and electronic tax administration processes to a fully automated system-to-system interaction model.
Mr Bawa noted that the legal framework for implementation is backed by the Nigeria Tax Administration Act, which prescribes penalties for non-compliance.
He disclosed that the NRS has completed onboarding large taxpayers and is preparing to enforce compliance with defaulting entities.
According to him, medium taxpayers are expected to begin compliance in the third quarter of 2026, while onboarding of emerging taxpayers will commence in 2027, with full adoption targeted for all taxpayers by the end of 2028.
Mr Bawa urged taxpayers yet to be onboarded onto the platform to begin the process and work with accredited service providers to ensure compliance.
On his part, Country Director of DigiTax Nigeria, Mr Olumide Akinsola, urged businesses to look beyond their internal systems and assess the compliance status of suppliers and counterparties.
He warned that businesses whose suppliers fail to transmit invoices through the MBS platform risk losing eligibility to claim Value Added Tax (VAT) input credits on such transactions, describing the resulting supply chain exposure as a significant commercial risk that many organisations have yet to quantify.
Mr Akinsola also announced the launch of DigiTax’s white paper, The State of E-Invoicing Readiness in Nigeria, which examines compliance adoption trends and the readiness gap across different taxpayer segments.
He added that DigiTax operates in Nigeria, Kenya, Zambia and the United Arab Emirates (UAE), noting that experience from those markets shows businesses that integrate early are better positioned to avoid disruptions when enforcement begins.
