Economy
Firm Unveils Volatility Index for Nigerian Stock Market
By Quantitative Financial Analytics
Stock market volatility is one of those words that are being thrown around every now and then when describing stock market behaviours.
For example, on January 29, 2016, The Vanguard had an article entitled, “Stock Market Volatility – Operators Seek Govt Intervention Fund”, and On November 11, 2017, it also had another article, The ‘Big Oil’ and market volatilities”.
In the same way, ThisDay newspaper, on June 23, 2014 wrote “Stock Market Volatility Persists”. Even on LinkedIn pages, people write about market volatilities like the one written by Rotimi Fakayejo, MD Enterprise StockBrokers Plc on September 9, 2015, who posted the article “Gainers & Losers of the volatility of the Nigerian Bourse” on his LinkedIn page.
The Guardian on its business page wrote, “Equities rise on the Exchange amid volatility” on February 8, 2015.
Those are excellent articles both in content and intent although some made it look like market volatility is necessarily a bad thing. But one thing lacking in the articles is the quantification of how volatile the Nigerian market had been or was expected to be.
There have been various explanations for increased or subdued volatilities in the market as some of those articles opined. One reason is the arrival of new and unanticipated information that tends to or alters the expected return on a stock.
News items like the Brexit, the Chinese contagion, escalation of the US-North Korea impasse can have remarkable effects on market volatility. Changes in volatility can even emanate from changes in investors’ behaviours like when investors panic in anticipation of an election result or FED or Central bank decisions on interest rates, etc.
Volatility does not imply that the market is collapsing; rather, it implies that the market is behaving in such a way that it is more difficult to make accurate predictions about the market based on currently prevailing data and information.
Depending on one’s investment strategy and horizon and subject to the availability of tradable financial instruments, investors can manage and even profit from volatility.
In more advanced markets with tradable financial products like variance and volatility swaps, volatility may present opportunities for profit.
It follows therefore that knowledge of volatility of returns in stock markets’ behaviour is of paramount importance to investors because such knowledge helps investors to know or gain more information on the data generating such returns.
Knowing how volatile the stock market has been or is expected to be, guides investors in their decision-making process as such knowledge enables them to access both the return potential of the market as well as the uncertainty of such returns.
Volatility is the “magnitude of movements regardless of direction” and stock market volatility relates to the magnitude of price changes without paying attention to whether the change is up or down.
Stock market volatility is captured by two broad measures: implied and realized volatility. Realized volatility differs from implied volatility.
While implied volatility is a forward-looking measure, realized volatility is historical or backward looking.
Implied volatility answers the question, what is the expected volatility of the market in so and so time while realized volatility answers the question, what was or is the actual market volatility in so and so period.
While realized volatility is based on the actual movement of an underlying, implied volatility is based on a value derived from associated options prices. Realized volatility measures real risk while implied volatility measures anticipated risk.
Indices that measure volatility abound the world over especially in more advanced markets. The Chicago Board of Exchange (CBOE)’s VIX, otherwise called the fear gauge, measures implied volatility in the US market while India VIX is a volatility index based on the NIFTY Index Option prices in India and is meant to measure implied volatility in Indian stock market.
In the UK, implied volatility is measured with the FTSE IVI and is based on the index’s underlying option prices. In abundance also are realized volatility measures in more advanced markets like those calculated by S&P Dow Jones.
Currently, there is no index that measures implied or realized volatilities of the Nigerian stock market. The absence of an implied volatility measure is understandable as such is derivable from options and options are non-existent in the Nigerian market.
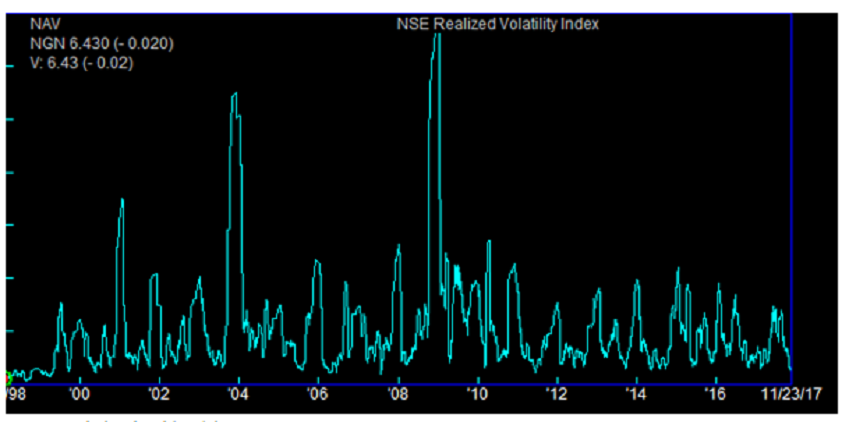
Realized volatility on the other hand, is derivable from historical data. To fill this gap, analysts at Quantitative Financial Analytics have come up with a Realized Volatility Index for the Nigerian Market.
The index is a one-month look back volatility measure of the NSE All Share index, (hereinafter called the underlying index). It assumes a 21-day monthly trading period and multiplies the result by 100 to reflect the index as a percentage.
The index is calculated daily and for all the trading dates that its underlying index (ASI) is calculated. The index has been calculated from 1998 to present and gives a bird’s eye view of the most and least volatile periods of the Nigerian stock market.
Comparatively speaking, the S&P 500 1-month realized index as at November 22, 2017 was 5.85, down from 5.87 the previous day while the Quantitative Financial Analytics (QFA) Nigeria All Share Index realized volatility index for corresponding period was 6.45, down from 6.55 the previous day.
Now, it is easy to talk about market volatility in Nigeria with some specifics and ability to compare with other markets and periods, at least in realized terms.
Quantitative Financial Analytics continues to add value to the Nigerian market with its many analytics.
It will be recalled that not long above, it rolled out its Fixed Income Analytics Report, which is a report with robust data and information on sovereign and corporate bonds trading in the Nigerian market.
For more information on the index and other reports, please contact us at analytics@mutualfundsnigeria.com
Economy
BoI, NLNG Launch Single Digit Interest Micro-Credit Scheme for MSMEs

By Adedapo Adesanya
The Nigeria LNG Limited and the Bank of Industry (BoI) have launched a Micro, Small and Medium Enterprises (MSMEs) finance scheme with a model that slashes loan interest rates to 9 per cent.
The initiative was piloted in Rivers State to stimulate grassroots economic growth and offer a lifeline for entrepreneurs navigating the current high-cost financial landscape.
The initiative is aimed at providing affordable credit and capacity-building to small businesses and vendors across NLNG’s host communities and Gas Transmission System areas.
Speaking at its relaunch in Port Harcourt, NLNG’s General Manager, External Relations and Sustainable Development, Mrs Sophia Horsfall, said it is a “transformative economic intervention” tailored to reduce poverty and drive sustainable development.
“More than just a micro-credit finance scheme—we ignite new possibilities for grassroots entrepreneurs and small businesses After years of funding and empowering local enterprises, we took a strategic pause to reassess and enhance our impact. This partnership with the Bank of Industry is a bold new step to drive real economic growth in Rivers State and beyond,” she averred.
Mrs Horsfall noted that rising commercial loan interest rates had necessitated NLNG’s intervention with a subsidized model.
“We have introduced a buffer that allows beneficiaries to access loans at a reduced interest rate of 9 per cent. It is not just about financing—it’s about transformation, empowerment, and long-term impact. As we take this bold step forward, we do so with pride, knowing that today, we are shaping a stronger, more sustainable future for all,” she noted.
Under the model, NLNG provides a seed fund matched by BOI, creating a robust pool to support micro-enterprises and local contractors.
The scheme is fully digitalised, with an online portal developed to streamline loan applications and disbursements, ensuring transparency and efficiency.
Representing the Managing Director of BOI, Mr Olasupo Olusi, the Executive Director for MSMEs, Mr Omar Shekarau, said the partnership aligns with the bank’s 2025–2027 corporate strategy, which targets inclusive and sustainable development across six key pillars: youth and skills, gender, digital, MSMEs, climate finance, and infrastructure.
“This partnership also reflects BOI’s reinforced focus. To ensure efficiency and transparency, BOI has deployed a cutting-edge end-to-end loan management platform, the BOI Fund Partner Solution, which allows fund partners real-time access to the performance of their fund.”
He added that BOI remains committed to making long-term, affordable financing available to Nigerian MSMEs while transforming the industrial landscape through strategic partnerships.
“Through this strategic collaboration with BOI, NLNG reinforces its commitment to fostering economic development, empowering local businesses, and sustaining long-term growth within its host communities,” he added.
The reintroduction of the scheme is being hailed as a major boost for small business owners grappling with limited access to credit facilities amidst Nigeria’s tough economic climate.
Economy
Nigeria Raises 182-Day Treasury Bills Rate to 19.50%

By Dipo Olowookere
The stop rates for the 91-day and 182-day treasury bills were raised by the Central Bank of Nigeria (CBN) on Wednesday, while that of the 364-day tenor was left unchanged as appetite for the long maturity slows.
Details of the exercise showed that the Central Bank of Nigeria (CBN), which sold the debt instrument through a primary market auction (PMA) for the Debt Management Office (DMO), jacked the rate for the three-month bill higher by 0.50 per cent and pushed the six-month paper higher by 1.00 per cent.
Business Post reports that the stop rate for the short-date instrument cleared yesterday at 18.50 per cent, the half-year note cleared at 19.50 per cent, and the one-year bill remained at 19.63 per cent.
The central bank was at the market with N50.00 billion worth of the 91-day treasury bills but received subscriptions valued at N114.30 billion, and allotted N111.81 billion.
It also auctioned N100.00 billion worth of the 182-day instrument during the session, but got bids valued at N107.09 billion and allotted N105.79 billion.
Like in the previous sessions, the 364-day bill was oversubscribed by investors, though the level was not like in the past. The apex bank offered to sell N650.00 billion worth of the paper to the market participants, but received offers valued at N905.56 billion and allotted N206.98 billion.
From the analysis, the CBN offered investors treasury bills worth N800 billion across the three maturities, but got bids valued at N1.127 trillion and allotted N424.58 billion.
Economy
MTN Plans Second Public Offer in Nigeria

By Adedapo Adesanya
African telecommunications giant, MTN Group, has announced plans to reduce its shareholding in MTN Nigeria through a public offer as it foresees the return of the Nigerian subsidiary to profitability this year.
The group aims to cut its stake from 76 per cent to 65 per cent in line with its longstanding commitment to deepen local ownership.
According to South African tech publication ITWeb, this was disclosed by Mr Ralph Mupita, MTN Group president, during an editors’ roundtable meeting on Tuesday.
“The only localisation we have as MTN Group is we have potentially a sell-down in Nigeria at some point in time, approximately 11 per cent.
“This is something we have said long ago, that over time we would want more Nigerians owning the company, and we are prepared to sell down to 65 per cent. We are at around 76 per cent,” he said.
The offer would mark MTN’s second major retail public offering in Nigeria, following its 2021 sale of 575 million MTN Nigeria shares to local investors.
The offer was oversubscribed, resulting in the allocation of 661.25 million shares, including a 15 per cent greenshoe option.
This reduced MTN’s stake in its Nigerian unit to 75.6 per cent from 78.8 per cent.
More than 126,000 investors participated in that round, including retail and institutional investors such as Nigerian pension funds representing approximately 6.5 million contributors.
At the time in 2022, MTN Group announced plans to further reduce its stake to approximately 65 per cent from 75.6 per cent.
Mr Mupita confirmed that the Group would only proceed with a new offer once MTN Nigeria resolves its negative equity position and resumes dividend payments.
Despite reporting revenue of N3.36 trillion in 2024, a 36.03 per cent rise from N2.47 trillion in 2023, it posted a loss after tax of N400.44 billion, a 192.25 per cent rise from N137.02 billion in 2023.,
This negative performance was driven by macroeconomic headwinds, including record inflation and a steep devaluation of the Naira, which raised operating costs and wiped out investor value.
As a result, MTN Nigeria lost its position to MTN South Africa as the group’s largest revenue contributor.
However, the Group is projecting a rebound in 2025, citing key drivers such as recent tariff adjustments, operational restructuring, and improving macroeconomic indicators in Nigeria.
Speaking at the roundtable, Mr Mupita highlighted that the Group is anticipating a V-shaped recovery in Nigeria’s service revenue.
He pointed to the recent structural reforms, such as the removal of fuel subsidies, the naira stabilisation, and improved Dollar availability.
“The continued normalisation of these factors, particularly naira stability, should have positive impacts on consumer spending power and our business operations,” Mr Mupita noted in the Group’s financial statement for 2024 recently.
-

 Feature/OPED5 years ago
Davos was Different this year
-
Travel/Tourism9 years ago
Lagos Seals Western Lodge Hotel In Ikorodu
-

 Showbiz2 years ago
Estranged Lover Releases Videos of Empress Njamah Bathing
-

 Banking7 years ago
Sort Codes of GTBank Branches in Nigeria
-

 Economy2 years ago
Subsidy Removal: CNG at N130 Per Litre Cheaper Than Petrol—IPMAN
-

 Banking2 years ago
First Bank Announces Planned Downtime
-

 Sports2 years ago
Highest Paid Nigerian Footballer – How Much Do Nigerian Footballers Earn
-

 Technology4 years ago
How To Link Your MTN, Airtel, Glo, 9mobile Lines to NIN


