

Connect with us

Economy

Firm Unveils Volatility Index for Nigerian Stock Market

Published

on

Volatility Index for Nigerian Stock Market
By Quantitative Financial Analytics

Stock market volatility is one of those words that are being thrown around every now and then when describing stock market behaviours.

For example, on January 29, 2016, The Vanguard had an article entitled, “Stock Market Volatility – Operators Seek Govt Intervention Fund”, and On November 11, 2017, it also had another article, The ‘Big Oil’ and market volatilities”.

In the same way, ThisDay newspaper, on June 23, 2014 wrote “Stock Market Volatility Persists”. Even on LinkedIn pages, people write about market volatilities like the one written by Rotimi Fakayejo, MD Enterprise StockBrokers Plc on September 9, 2015, who posted the article “Gainers & Losers of the volatility of the Nigerian Bourse” on his LinkedIn page.

The Guardian on its business page wrote, “Equities rise on the Exchange amid volatility” on February 8, 2015.

Those are excellent articles both in content and intent although some made it look like market volatility is necessarily a bad thing. But one thing lacking in the articles is the quantification of how volatile the Nigerian market had been or was expected to be.

There have been various explanations for increased or subdued volatilities in the market as some of those articles opined. One reason is the arrival of new and unanticipated information that tends to or alters the expected return on a stock.

News items like the Brexit, the Chinese contagion, escalation of the US-North Korea impasse can have remarkable effects on market volatility. Changes in volatility can even emanate from changes in investors’ behaviours like when investors panic in anticipation of an election result or FED or Central bank decisions on interest rates, etc.

Volatility does not imply that the market is collapsing; rather, it implies that the market is behaving in such a way that it is more difficult to make accurate predictions about the market based on currently prevailing data and information.

Depending on one’s investment strategy and horizon and subject to the availability of tradable financial instruments, investors can manage and even profit from volatility.

In more advanced markets with tradable financial products like variance and volatility swaps, volatility may present opportunities for profit.

It follows therefore that knowledge of volatility of returns in stock markets’ behaviour is of paramount importance to investors because such knowledge helps investors to know or gain more information on the data generating such returns.

Knowing how volatile the stock market has been or is expected to be, guides investors in their decision-making process as such knowledge enables them to access both the return potential of the market as well as the uncertainty of such returns.

Volatility is the “magnitude of movements regardless of direction” and stock market volatility relates to the magnitude of price changes without paying attention to whether the change is up or down.

Stock market volatility is captured by two broad measures: implied and realized volatility. Realized volatility differs from implied volatility.

While implied volatility is a forward-looking measure, realized volatility is historical or backward looking.

Implied volatility answers the question, what is the expected volatility of the market in so and so time while realized volatility answers the question, what was or is the actual market volatility in so and so period.

While realized volatility is based on the actual movement of an underlying, implied volatility is based on a value derived from associated options prices. Realized volatility measures real risk while implied volatility measures anticipated risk.

Indices that measure volatility abound the world over especially in more advanced markets. The Chicago Board of Exchange (CBOE)’s VIX, otherwise called the fear gauge, measures implied volatility in the US market while India VIX is a volatility index based on the NIFTY Index Option prices in India and is meant to measure implied volatility in Indian stock market.

In the UK, implied volatility is measured with the FTSE IVI and is based on the index’s underlying option prices. In abundance also are realized volatility measures in more advanced markets like those calculated by S&P Dow Jones.

Currently, there is no index that measures implied or realized volatilities of the Nigerian stock market. The absence of an implied volatility measure is understandable as such is derivable from options and options are non-existent in the Nigerian market.

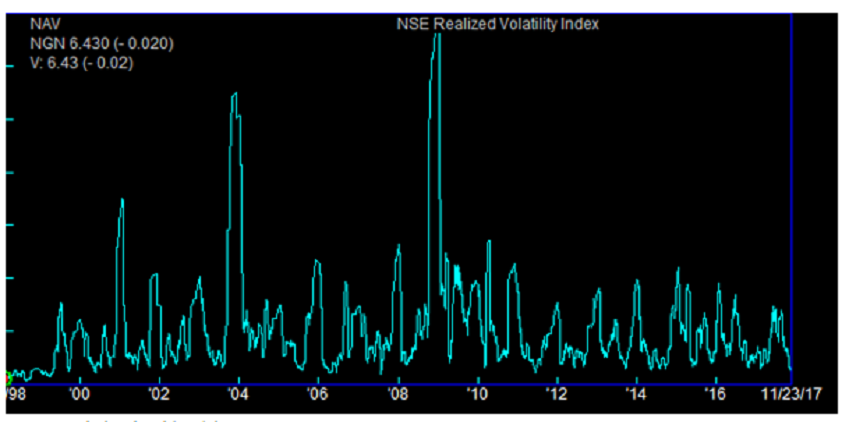
Realized volatility on the other hand, is derivable from historical data. To fill this gap, analysts at Quantitative Financial Analytics have come up with a Realized Volatility Index for the Nigerian Market.

The index is a one-month look back volatility measure of the NSE All Share index, (hereinafter called the underlying index). It assumes a 21-day monthly trading period and multiplies the result by 100 to reflect the index as a percentage.

The index is calculated daily and for all the trading dates that its underlying index (ASI) is calculated. The index has been calculated from 1998 to present and gives a bird’s eye view of the most and least volatile periods of the Nigerian stock market.

Comparatively speaking, the S&P 500 1-month realized index as at November 22, 2017 was 5.85, down from 5.87 the previous day while the Quantitative Financial Analytics (QFA) Nigeria All Share Index realized volatility index for corresponding period was 6.45, down from 6.55 the previous day.

Now, it is easy to talk about market volatility in Nigeria with some specifics and ability to compare with other markets and periods, at least in realized terms.

Quantitative Financial Analytics continues to add value to the Nigerian market with its many analytics.

It will be recalled that not long above, it rolled out its Fixed Income Analytics Report, which is a report with robust data and information on sovereign and corporate bonds trading in the Nigerian market.

For more information on the index and other reports, please contact us at an*******@****************ia.com

Dipo Olowookere is a journalist based in Nigeria that has passion for reporting business news stories. At his leisure time, he watches football and supports 3SC of Ibadan. Mr Olowookere can be reached via [email protected]

Click to comment

Leave a Reply

Your email address will not be published. Required fields are marked *

Economy

Financial Stocks Account for 79.48% of Total Weekly Trading Volume on NGX

Published

on

financial stocks

By Dipo Olowookere

On the Nigerian Exchange (NGX) Limited last week, investors transacted 3.648 billion shares worth N220.568 billion in 251,861 deals compared with the 3.821 billion shares valued at N154.393 billion traded in 258,567 deals a week earlier.

Analysis showed that financial stocks led the activity chart with 2.899 billion units sold for N147.360 billion in 106,603 deals, accounting for 79.48 per cent and 66.81 per cent of the total trading volume and value, respectively.

Services equities recorded a turnover of 164.914 million units valued at N3.615 billion in 16,375 deals, and the consumer goods shares exchanged 157.451 million units worth N7.777 billion in 27,950 deals.

First Holdco, Zenith Bank, and Fidelity Bank were the busiest stocks for the five-day trading week, trading 1.745 billion units valued at N121.828 billion in 31,053 deals, contributing 47.85 per cent and 55.23 per cent to the total trading volume and value, respectively.

Business Post reports that 60 equities appreciated during the week versus 22 equities in the previous week, 28 shares depreciated versus 57 shares of the preceding week, and 58 stocks closed flat versus 67 stocks of the previous week.

International Breweries gained 40.00 per cent to trade at N13.30, RT Briscoe expanded by 32.02 per cent to N13.40, Livestock Feeds improved by 28.47 per cent to N9.25, First Holdco chalked up 25.82 per cent to close at N69.20, and Abbey Bank rose by 23.65 per cent to N9.15.

On the flip side, McNichols lost 28.57 per cent to finish at N5.00, Thomas Wyatt gave up 11.64 per cent to quote at N2.43, Geregu Power declined by 10.00 per cent to N825.70, CAP shed 9.99 per cent to settle at N157.60, and Guinness Nigeria also slipped by 9.99 per cent to N329.00.

Customs Street was under buying pressure last week, making the All-Share Index (ASI) and the market capitalisation close higher by 6.35 per cent to 243,798.76 points and N156.445 trillion, respectively.

In the same vein, all other indices finished higher apart from the growth and sovereign bond indices, which depreciated by 7.43 per cent and 0.02 per cent, respectively.

Continue Reading

Economy

NASD OTC Market Gains 2.3%, Adds N58bn to Investors’ Wealth

Published

on

NASD OTC market

By Adedapo Adesanya

The NASD Over-the-Counter (OTC) Securities Exchange rose by 2.30 per cent, spurring the NASD Security Index (NSI) to close higher by 96.61 points to 4,296.34 points from 4,199.73 points, and raising the market capitalisation by N57.99 billion to N2.578 trillion from N2.521 trillion.

The market was up yesterday despite a lower activity level, as the volume of securities traded slumped by 94.7 per cent to 1.3 million units from the previous 23.9 million units. The value of securities slipped by 57.2 per cent to N29.2 million from the preceding session’s N68.2 million, while the number of deals executed by market participants increased by 6.7 per cent to 32 deals from the 30 deals carried out on Thursday.

At the close of transactions, Great Nigeria Insurance (GNI) Plc remained the most traded stock by value on a year-to-date basis, with a turnover of 3.4 billion units worth N8.4 billion, trailed by Infrastructure Credit Guarantee (Infracredit) Plc with 2.3 billion units valued at N6.5 billion in trades, and Central Securities Clearing System (CSCS) Plc with 70.8 million units traded for N4.9 billion.

GNI Plc was also the most traded stock by volume on a year-to-date basis, with 3.4 billion units sold for N8.4 billion, followed by Infracredit Plc with 2.3 billion units exchanged for N6.5 billion, and Resourcery Plc with 1.1 billion units transacted for N415.7 million.

During the trading day, there were three price gainers and two price losers, led by Afriland Properties Plc, which shed N1.48 to sell at N15.17 per share compared with the previous session’s N16.65 per share, and Food Concepts Plc, which slid by 7 Kobo to close at N2.69 per unit versus N2.76 per unit.

Conversely, FrieslandCampina Wamco Nigeria Plc improved its value by N9.50 to trade at N150.00 per share compared with Thursday’s closing price of N140.50 per share, CSCS Plc went up by N7.95 to N89.65 per unit from N81.70 per unit, and 11 Plc soared by N6.94 to N206.95 per share from N200.01 per share.

Continue Reading

Economy

Guinness Nigeria, Others Drown Stock Exchange by 0.07%

Published

on

exposure to Nigerian stocks

By Dipo Olowookere

The Nigerian Exchange (NGX) Limited lost its footing by 0.07 per cent on Friday as a result of renewed profit-taking by investors.

The fall happened after Thomas Wyatt and Guinness Nigeria led other price losers group comprising 27 stocks at the market yesterday due to selling pressure.

Thomas Wyatt Nigeria shed 10.00 per cent to quote at N2.70, Guinness Nigeria drowned by 9.99 per cent to close at N329.00, Ikeja Hotel slipped by 9.96 per cent to N42.50, Zichis shed 9.94 per cent to trade at N26.37, and McNichols depreciated by 9.91 per cent to N5.00.

On the flip side, International Breweries gained 9.92 per cent to finish at N13.30, NEM Insurance appreciated by 9.61 per cent to N27.95, Jaiz Bank grew by 6.36 per cent to N9.20, UPDC expanded by 6.33 per cent to N4.20, and Livestock Feeds increased by 6.32 per cent to N9.25.

Business Post reports that investor sentiment remained bullish despite the loss recorded during the session, as there were 27 price decliners and 30 price advancers, representing a positive market breadth index.

Yesterday, market participants transacted 441.3 million equities for N19.4 billion in 44,938 deals compared with the 1.7 billion equities worth N112.0 billion traded in 44,780 deals a day earlier. This showed that the trading volume contracted by 74.04 per cent, the trading value declined by 82.68 per cent, and an uptick in the number of deals by 0.35 per cent.

Access Holdings led the activity chart on Friday after selling 40.2 million shares valued at N1.0 billion, Sterling Holdco traded 30.3 million stocks worth N228.8 million, Fidelity Bank sold 26.3 million equities for N505.6 million, Zenith Bank transacted 22.3 million shares valued at N2.5 billion, and First Holdco exchanged 19.0 million stocks worth N1.3 billion.

During the last trading session of the week, the consumer goods sector rose by 0.49 per cent, the insurance counter increased by 0.06 per cent, and the industrial goods index closed flat, while the banking and energy indices lost 0.78 per cent and 0.52 per cent, respectively.

As a result, the All-Share Index (ASI) shrank by 159.97 points to 243,798.76 points from 243,958.73 points, and the market capitalisation moderated by N103 billion to N156.445 trillion from N156.548 trillion.

Continue Reading