
Economy
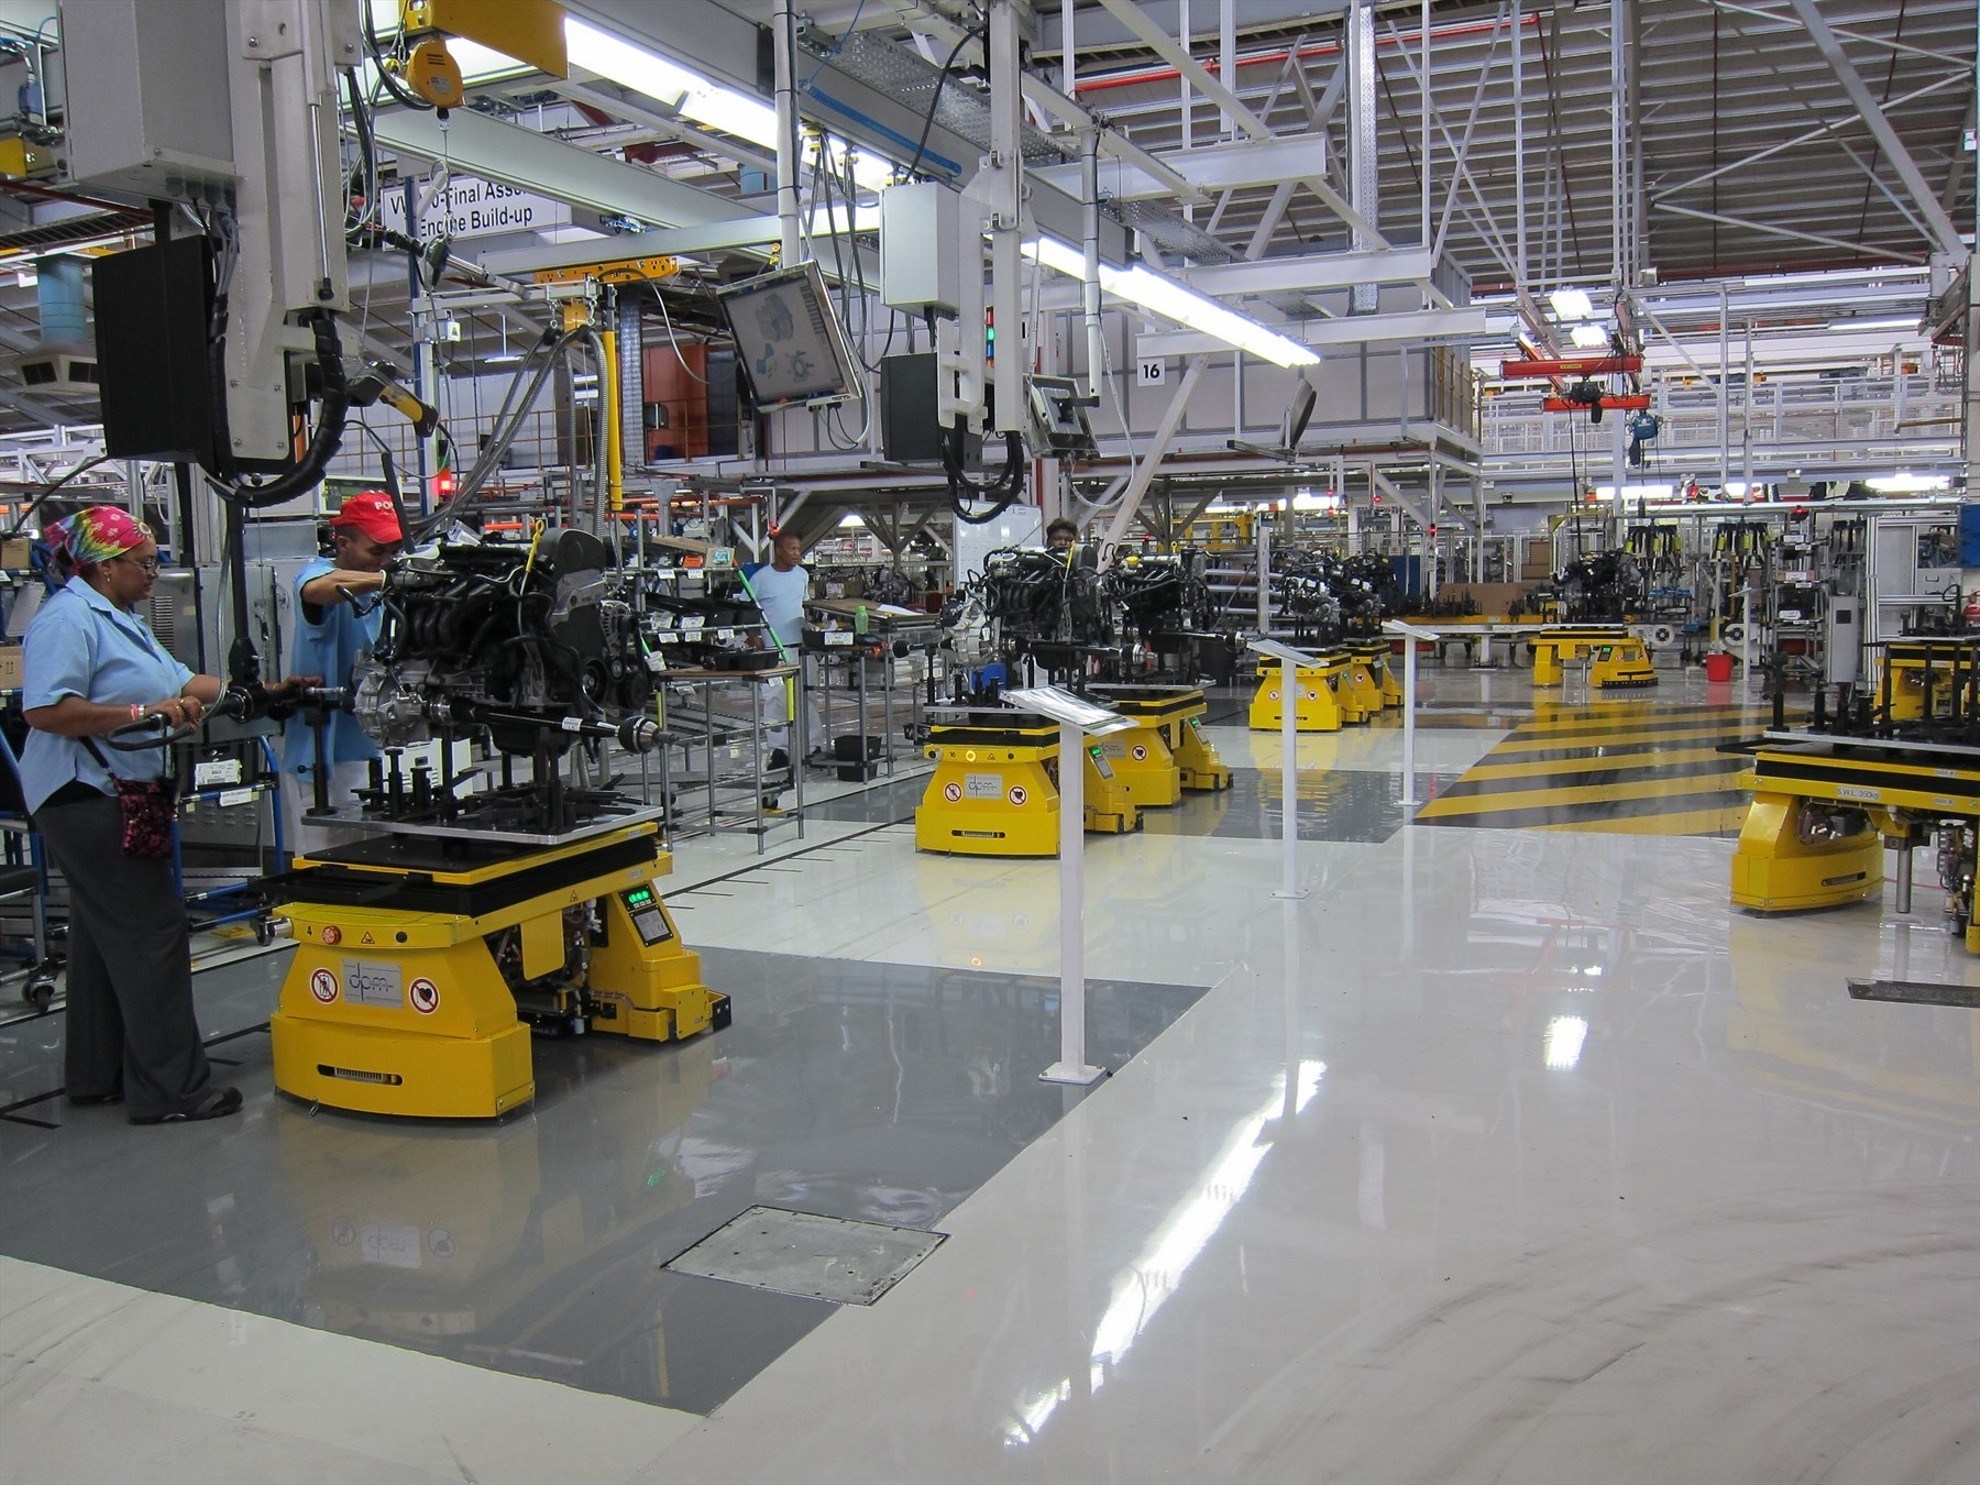
BUA Cement, Others Boost Nigeria’s Manufacturing Production Value to N3.73trn

By Adedapo Adesanya
Nigeria’s manufacturing sector recorded N3.73 trillion in production in the second half of 2021, 58.1 per cent higher than the N2.36 trillion reported in the corresponding half of 2020.
The president of the Manufacturers Association of Nigeria (MAN), Mr Mansur Ahmed, disclosed at a presentation on Thursday that this growth is indicative of the development in the industry.
He noted that the manufacturing production value increased by N0.07 trillion or 1.9 per cent when compared with the N3.66 trillion achieved in the first half of last year, while the total value of production for the year stood at N7.03 trillion as against the N4.42 trillion posted in 2020, which was ravaged by COVID-19, which prompted lockdown in most part of the year.
Mr Ahmed said the increase in the manufacturing production value in the second half of 2021 was associated with increased cement production due to the new BUA cement factory in Sokoto; the African Glass new factory and activities of the five new papermills.
“This is also highlighted by the increased production value in the non-metallic mineral products sector to N374.41 billion in the second half of 2021 from N74.18 billion and N249.79 billion recorded in the corresponding half in 2020 and the preceding half respectively,” he said.
Also, capacity utilisation in the manufacturing sector increased to 59 per cent in the second half of 2021 from 53.7 per cent recorded in the corresponding half of 2020; indicating a 5.3 per cent increase over the period.
It increased by 6.6 per cent when compared with 52.4 per cent recorded in the preceding half and averaged 58.9 per cent in 2021 from the 49.5 per cent average in 2020.
He said Mr Ahmed attributed the increase in manufacturing capacity utilisation to the phasing of economic and social restrictions meant to contain the COVID-19 pandemic and the full rebounding of economic activities globally within the period.
“In addition, there are increased capacities in the paper subsector brought in by five new paper mills that are into recycling of waste papers to produce cartons.
“Also, the additional capacities as BUA Group introduced a cement factory in Sokoto and the new African Glass Ltd. factory that produced glass products influenced the development.
“The performance shows that manufacturing is fast returning to the 2019 pre-COVID-19 level of activities in the country,” he said.
The MAN President revealed that investments in the manufacturing sector increased to N73.18 billion from N56.44 billion recorded in the corresponding half of 2020; indicating N16.74 billion or 29.7 per cent increase over the period.
Ahmed said it increased by N70.96 billion or 49.3 per cent when compared with N144.14 billion recorded in the preceding half with manufacturing investment totalling N217.22 billion in 2021 as against N118.52 billion in 2020.
Manufacturing investment has been gradually recovering following the return of economic activities as the issues of the COVID-19 pandemic are continuously resolved.
“In the last year, significant investment has been recorded in the Pulp, Paper, Printing & Publishing (6Ps) sector with the establishment of five new paper mills that are into recycling of waste papers to produce cartons.
“There is also the new BUA Group cement factory in Sokoko; and the new African Glass Limited factory that produced glass products,” he said.
Also, the total historical cumulative jobs in the manufacturing sector were estimated at 1,671,441 by the end of 2021, based on surveys conducted since 2013.
According to the report, a total of 8,508 jobs were created in the sector in the second half of 2021 as against 3,451 jobs recorded in the corresponding half of 2020 and 7,602 jobs created in the preceding half.
“The total net employment in the sector in 2021, after adjusting for job losses was 11,659 while net job losses in 2020 were 3,257.
“The trend indicates that manufacturing job is also rebounding following the gradual return of economic activities in the sector after a year onslaught brought by COVID-19 pandemic,” it read.
Mr Ahmed said Foreign Direct Investment (FDI) recorded $107.81 million in the third quarter of 2021; translating to a pick up from the downward trend of FDI in the country since the fourth quarter of 2020.
He said the association’s data also revealed an increase from $77.97 million recorded in the second quarter of 2021, which was the lowest level recorded for the past 11 years.
He noted that the report of the manufacturing sector’s FDI revealed an uptick in the third quarter of 2021 when compared with the data recorded in the last three quarters.
“Therefore, the third quarter figure of $107.81 million indicates 29.84 million dollars or 38.27 per cent increase when compared with $77.97 million recorded in the second quarter.
“The figure indicates a drop of $306.98 million or 74.01 per cent when compared with $414.79 million recorded in the corresponding quarter of 2020.
“The third quarter report of NBS revealed that the foreign Portfolio Investment increased to 1217.21 million dollars from $551.37 million dollars indicating, $665.84 million or 120.76 per cent increase over the period,” he said.
Similarly, the figure revealed an increase of $809.96 million or 198.89 per cent when compared with $407.25 million recorded in the corresponding quarter of 2020.
“The FDI increased to $323.83 million in the third quarter of 2021 from 68.03 million dollars recorded in the second quarter of 2021, thus indicating $255.80 million or 376.01 per cent increase over the period.
“However, the report indicated $76.26 million or 19.06 reduction when compared to $400.09 million recorded in the third quarter of 2020,” Mr Ahmed added.
He, however, said local raw materials utilisation in the manufacturing sector dipped to 51.7 per cent in the review period from 56.5 per cent in the corresponding period of 2020; indicating a 4.8 per cent decline over the period.
He noted that since the full opening of the economy from the COVID-19 pandemic, local raw materials and other manufacturing inputs had been relatively scarce and costly.
The MAN boss also said the inventory of unsold finished products dipped to N224.63 billion in the second half of 2021 from N303.22 billion recorded in the corresponding half of 2020.
This, he said, indicated a N78.59 billion or 25.9 per cent decline over the period.
“However, it increased by N9.8 billion or 4.6 per cent when compared with N214.83 billion recorded in the preceding half.
“Inventory in the sector totalled N439.46 billion in 2021 as against N577.61 billion recorded in 2020. “The decline in inventory in the period under review was attributed to the recovering aggregate consumption following the gradual rebounding of economic activities as COVID-19 pandemic receded,” he said.


By Dipo Olowookere
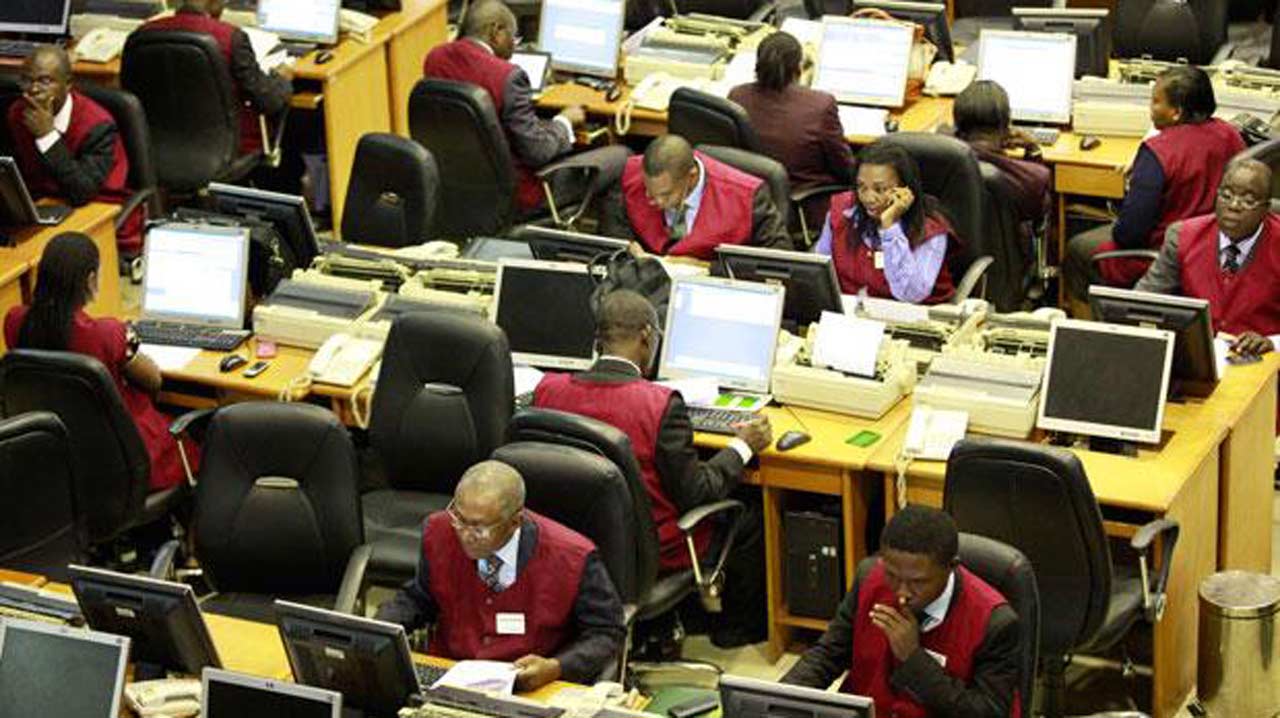
The Nigerian stock market crashed by 2.35 per cent on Wednesday after some bellwether equities performed badly as a result of profit-taking in them.
BUA Cement, Dangote Cement, and Geregu Power lost 10.00 per cent each to settle at N340.20, N963.00, and N917.40, respectively. Custodian Investment shrank by 9.97 per cent to N73.15, and Academy Press weakened by 9.88 per cent to N28.12.
On the flip side, SAHCO gained 9.92 per cent to trade at N171.20, International Energy Insurance grew by 9.66 per cent to N6.70, Tantalizers improved by 6.98 per cent to N4.60, Omatek added 5.70 per cent to close at N2.04, and AIICO Insurance increased by 5.19 per cent to N4.26.
At the close of business, the Nigerian Exchange (NGX) Limited recorded 10 appreciating stocks and 21 depreciating stocks.
Data from the activity log revealed that 488.1 million shares worth N20.9 billion exchanged hands in 46,239 deals at midweek compared with the 564.9 million shares valued at N39.4 billion traded in 49,230 deals on Tuesday, representing a fall in the trading volume, value, and number of deals by 13.60 per cent, 46.95 per cent, and 6.08 per cent, respectively.
On top of the activity chart yesterday was First Holdco, which sold 57.4 million equities for N3.5 billion. Chams transacted 42.3 million shares valued at N166.9 million, Access Holdings traded 36.1 million stocks worth N831.1 million, Linkage Assurance exchanged 32.0 million equities for N49.4 million, and Sterling Holdings traded 29.4 million shares valued at N224.8 million.
Business Post observed that the bears dominated Customs Street during the trading day, resulting in all the major sectors closing in the red.
The industrial goods space suffered the heaviest loss, 8.31 per cent, as a result of the sell-offs in cement stocks. The insurance counter shed 0.97 per cent, the banking segment declined by 0.71 per cent, the consumer goods landscape gave up 0.29 per cent, and the energy sector crumbled by 0.11 per cent.
Consequently, the All-Share Index (ASI) retreated by 5,668.65 points to 235,074.54 points from 240,743.19 points, and the market capitalisation moderated by N3.637 trillion to N150.847 trillion from N154.484 trillion.
By Adedapo Adesanya
Easing tensions between the US and Iran in the Middle East is expected to offer more respite to the Nigerian economy in the coming months.
Analysts at Comercio Partners noted in a report that there is an increased likelihood of a gradual moderation in inflation from July into the third quarter of 2026.
The analysts opined that the near-term outlook for inflation “has become less tilted to the upside” following the peace deal reached by the warring parties in the Middle East conflict and the sharp decline in global oil prices.
The report read in part: “May inflation data showed that price pressures remain sticky, but the near-term outlook has become less tilted to the upside following the peace deal and the sharp decline in global oil prices.
“Headline inflation rose to 15.93 per cent year-on-year from 15.69 per cent in April, while food inflation climbed to 16.96 per cent and core inflation increased to 16.82 per cent, suggesting that both food and underlying non-food price pressures remain elevated.
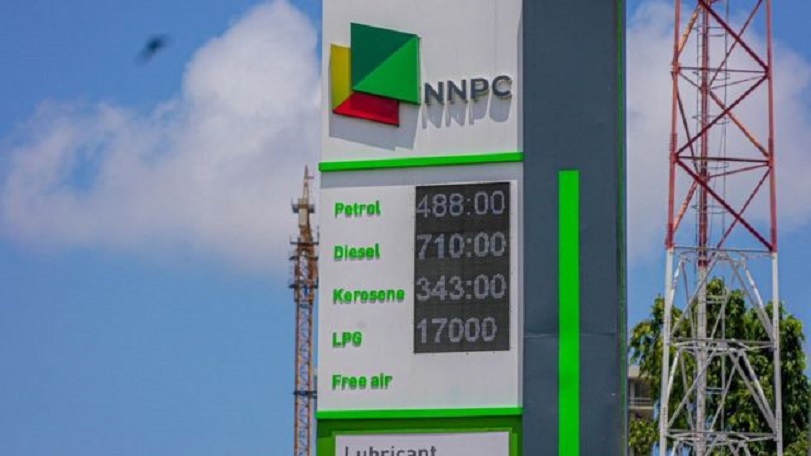
“However, the easing in crude oil prices below $85/bbl reduces the risk of a renewed energy-led inflation shock. This is important for Nigeria, where fuel, diesel, transport, logistics, and food distribution costs are key channels through which global energy prices feed into domestic inflation.
“If lower oil prices are sustained and domestic fuel prices remain stable or decline, pressure on transport and production costs should gradually ease.”
It noted that in June, inflation may remain sticky because the pass-through of lower oil prices to consumer prices is unlikely to be immediate.
It added that food prices remain elevated, and core inflation picked up month-on-month in May, indicating that underlying price pressures have not fully faded. According to the National Bureau of Statistics (NBS), the inflation rate on a month-on-month basis was 1.75 per cent, which was 0.39 per cent lower than the rate recorded in April 2026 (2.13 per cent).
“However, the balance of risks has shifted. The likelihood of another sharp energy-driven acceleration has reduced, while the probability of gradual moderation from July into Q3 has improved.”
The analysts said in the report that while the latest CPI data, “still supports a cautious tone across rates and fixed income, as annual headline, food, and core inflation all moved higher in May,” the decline in oil prices gives the Central Bank of Nigeria (CBN) “more room to maintain a wait-and-see stance rather than respond aggressively to external energy-price risks, provided domestic prices begin to reflect the easing in global crude markets.”
Economy
All On Invests $1m in Eja-Ice Nigeria Limited to Strengthen Cold-Chain Infrastructure in Off-Grid Markets

All On, an impact investing company focused on expanding access to renewable energy solutions in Nigeria, has announced a $1 million investment in Eja-Ice Nigeria Limited, a provider of solar-powered refrigeration and cold chain infrastructure.
The investment will support Eja-Ice’s manufacturing and operational scale-up as the company enters its next phase of growth. It is expected to enable the expansion of its cold-chain solutions and improve access to reliable cooling services for households, small businesses, and institutions operating in off-grid and weak-grid environments.
Access to dependable cold storage remains a significant constraint across Nigeria, particularly in coastal and rural communities where limited energy infrastructure contributes to post-harvest losses and income instability for small-scale agro-producers.
By delivering energy-efficient refrigeration systems, Eja-Ice is helping to address these challenges while supporting the preservation of perishable goods and strengthening local value chains.
“All On’s investment in Eja-Ice reflects our approach of supporting solutions that improve energy access while enhancing livelihoods, reducing costs, and enabling businesses to grow. Strengthening cold-chain infrastructure is an important step towards building more resilient local economies and expanding opportunities in underserved markets,” the chief executive of All On, Ms Caroline Eboumbou, commented on the investment.
Eja-Ice’s integrated cold-chain model allows for greater control over product design, operational efficiency, and service delivery, ensuring that its solutions are tailored to the needs of underserved markets. The company’s systems are already supporting micro enterprises, cooperatives, and community-level infrastructure, particularly in areas where reliable electricity remains limited.
Also commenting, the founder and chief executive of Eja-Ice Nigeria Limited, Mr Yusuf Bilesanmi, said, “This capital raise is a huge step forward in our vision to power homes and businesses with products designed, assembled, and optimised right here on the continent. It’s not just about access to electricity—it’s about dignity, productivity, and opportunity for the over 600 million people across sub-Saharan Africa who are still off-grid.”
Through this investment, All On continues to advance its mission of closing Nigeria’s energy access gap by supporting the renewable energy ecosystem and businesses that deliver sustainable, market-driven solutions.


-
 Feature/OPED6 years ago
Davos was Different this year
-
Travel/Tourism10 years ago
Lagos Seals Western Lodge Hotel In Ikorodu
-

 Showbiz3 years ago
Estranged Lover Releases Videos of Empress Njamah Bathing
-
 Banking8 years ago
Sort Codes of GTBank Branches in Nigeria
-

 Economy3 years ago
Subsidy Removal: CNG at N130 Per Litre Cheaper Than Petrol—IPMAN
-
 Banking3 years ago
Sort Codes of UBA Branches in Nigeria
-

 Banking3 years ago
First Bank Announces Planned Downtime
-

 Sports3 years ago
Highest Paid Nigerian Footballer – How Much Do Nigerian Footballers Earn