Economy
Firm Unveils Volatility Index for Nigerian Stock Market
By Quantitative Financial Analytics
Stock market volatility is one of those words that are being thrown around every now and then when describing stock market behaviours.
For example, on January 29, 2016, The Vanguard had an article entitled, “Stock Market Volatility – Operators Seek Govt Intervention Fund”, and On November 11, 2017, it also had another article, The ‘Big Oil’ and market volatilities”.
In the same way, ThisDay newspaper, on June 23, 2014 wrote “Stock Market Volatility Persists”. Even on LinkedIn pages, people write about market volatilities like the one written by Rotimi Fakayejo, MD Enterprise StockBrokers Plc on September 9, 2015, who posted the article “Gainers & Losers of the volatility of the Nigerian Bourse” on his LinkedIn page.
The Guardian on its business page wrote, “Equities rise on the Exchange amid volatility” on February 8, 2015.
Those are excellent articles both in content and intent although some made it look like market volatility is necessarily a bad thing. But one thing lacking in the articles is the quantification of how volatile the Nigerian market had been or was expected to be.
There have been various explanations for increased or subdued volatilities in the market as some of those articles opined. One reason is the arrival of new and unanticipated information that tends to or alters the expected return on a stock.
News items like the Brexit, the Chinese contagion, escalation of the US-North Korea impasse can have remarkable effects on market volatility. Changes in volatility can even emanate from changes in investors’ behaviours like when investors panic in anticipation of an election result or FED or Central bank decisions on interest rates, etc.
Volatility does not imply that the market is collapsing; rather, it implies that the market is behaving in such a way that it is more difficult to make accurate predictions about the market based on currently prevailing data and information.
Depending on one’s investment strategy and horizon and subject to the availability of tradable financial instruments, investors can manage and even profit from volatility.
In more advanced markets with tradable financial products like variance and volatility swaps, volatility may present opportunities for profit.
It follows therefore that knowledge of volatility of returns in stock markets’ behaviour is of paramount importance to investors because such knowledge helps investors to know or gain more information on the data generating such returns.
Knowing how volatile the stock market has been or is expected to be, guides investors in their decision-making process as such knowledge enables them to access both the return potential of the market as well as the uncertainty of such returns.
Volatility is the “magnitude of movements regardless of direction” and stock market volatility relates to the magnitude of price changes without paying attention to whether the change is up or down.
Stock market volatility is captured by two broad measures: implied and realized volatility. Realized volatility differs from implied volatility.
While implied volatility is a forward-looking measure, realized volatility is historical or backward looking.
Implied volatility answers the question, what is the expected volatility of the market in so and so time while realized volatility answers the question, what was or is the actual market volatility in so and so period.
While realized volatility is based on the actual movement of an underlying, implied volatility is based on a value derived from associated options prices. Realized volatility measures real risk while implied volatility measures anticipated risk.
Indices that measure volatility abound the world over especially in more advanced markets. The Chicago Board of Exchange (CBOE)’s VIX, otherwise called the fear gauge, measures implied volatility in the US market while India VIX is a volatility index based on the NIFTY Index Option prices in India and is meant to measure implied volatility in Indian stock market.
In the UK, implied volatility is measured with the FTSE IVI and is based on the index’s underlying option prices. In abundance also are realized volatility measures in more advanced markets like those calculated by S&P Dow Jones.
Currently, there is no index that measures implied or realized volatilities of the Nigerian stock market. The absence of an implied volatility measure is understandable as such is derivable from options and options are non-existent in the Nigerian market.
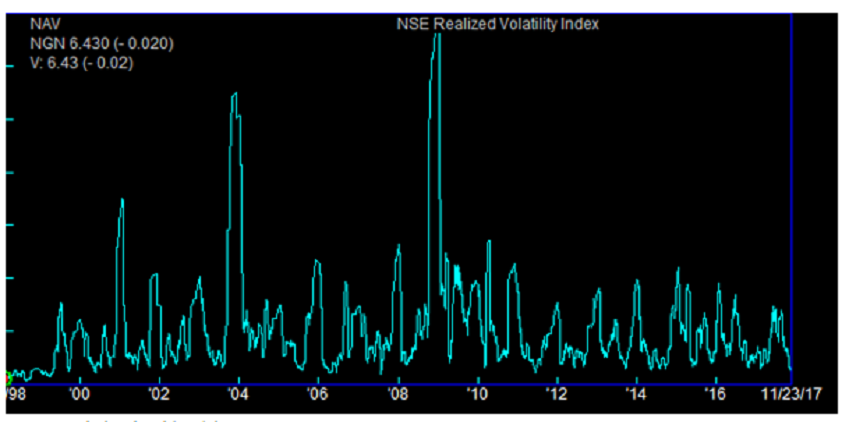
Realized volatility on the other hand, is derivable from historical data. To fill this gap, analysts at Quantitative Financial Analytics have come up with a Realized Volatility Index for the Nigerian Market.
The index is a one-month look back volatility measure of the NSE All Share index, (hereinafter called the underlying index). It assumes a 21-day monthly trading period and multiplies the result by 100 to reflect the index as a percentage.
The index is calculated daily and for all the trading dates that its underlying index (ASI) is calculated. The index has been calculated from 1998 to present and gives a bird’s eye view of the most and least volatile periods of the Nigerian stock market.
Comparatively speaking, the S&P 500 1-month realized index as at November 22, 2017 was 5.85, down from 5.87 the previous day while the Quantitative Financial Analytics (QFA) Nigeria All Share Index realized volatility index for corresponding period was 6.45, down from 6.55 the previous day.
Now, it is easy to talk about market volatility in Nigeria with some specifics and ability to compare with other markets and periods, at least in realized terms.
Quantitative Financial Analytics continues to add value to the Nigerian market with its many analytics.
It will be recalled that not long above, it rolled out its Fixed Income Analytics Report, which is a report with robust data and information on sovereign and corporate bonds trading in the Nigerian market.
For more information on the index and other reports, please contact us at an*******@****************ia.com


By Adedapo Adesanya
Brent crude prices fell by $3.05 or 3.37 per cent to $87.33 per barrel on Friday, the lowest level since early March, triggered by expectations of an imminent peace agreement between the United States and Iran.
Also, the US West Texas Intermediate (WTI) crude finished at $84.88 a barrel after it gave up $2.83 or 3.23 per cent. It was its lowest level since April 17.
Reuters reported that a memorandum between the US and Iran to halt the war in the Gulf could be signed as soon as Sunday, citing sources.
The sources indicate that the US would immediately begin releasing billions of Dollars in frozen Iranian assets and waive sanctions on its oil exports, in return for Iran opening the strait.
The proposals also include discussion of possible war reparations for Iran and dropping longstanding US demands for limits on Iran’s missile program, the sources were quoted as saying.
Meanwhile, Iranian Foreign Minister Abbas Araqchi said on Friday that a memorandum of understanding had not yet been signed and could still change.
He also said that management of the Strait of Hormuz would not return to the pre-war era, that sovereignty over the strait belonged to Iran and Oman, and that Iran would secure safe passage for ships through it.
US President Donald Trump called off threatened air strikes against Iran on Thursday, while it was reported that final negotiations on the memorandum would focus on nuclear and economic issues but would exclude discussions about Iran’s missile programme.
On Thursday, Iran announced a complete closure of the Strait of Hormuz, saying it would fire on any ship trying to pass through.
Traffic through the strait, which normally carries a fifth of global oil and liquefied natural gas shipments, has been extremely limited as a result of the war.
The US military, however, said on social media that commercial ships continued to transit the waterway.
Goldman Sachs lowered its 2027 average Brent forecast to $80 a barrel on higher supply and lower demand, but expects prices to exceed the 2025 average on stockpiling of OECD commercial oil stocks and a security premium for disruptions.
The Organisation of the Petroleum Exporting Countries (OPEC) on Thursday lowered its forecast for 2026 world oil demand growth to 970,000 barrels per day from a previous 1.17 million barrels per day, its second straight downward revision.

By Modupe Gbadeyanka
The Lagos-based Dangote Petroleum Refinery has been described by Standard Bank Group as a transformational industrial project with far-reaching implications for Nigeria and Africa.
The company, which is Africa’s largest financial institution, gave this description after a tour of the facility recently.
Standard Bank, the parent company of Stanbic IBTC Holdings, has promised to support the planned listing of the 650,000 barrels per day refinery and expressed readiness to finance future expansion projects across the continent.
The chief executive of the lender, Mr Sim Tshabalala, said, “We are here because the Dangote Group is a large and important global player and a significant force on the African continent.”
“Standard Bank is the largest financial institution in Africa, and we have partnered with Dangote on a variety of initiatives. We are here to lend support, to see this magnificent refinery and to discuss Vision 2030 and how we can continue supporting the Group’s growth ambitions,” he added.
Mr Tshabalala disclosed that Standard Bank intends to play a leading role in the refinery’s planned Initial Public Offering and future growth initiatives.
“As Dangote lists, there is an IPO coming up, and we are a leading player in that process,” he said, adding that, “As the group continues to expand in Nigeria and across Africa, there will be opportunities for financial advisory services and balance sheet support, and we stand ready to provide both.”
He further described the refinery as “a wonder of the world,” noting that its impact is already being felt through stronger foreign exchange earnings, improved balance-of-payments performance and enhanced energy security.
“This is a wonder to behold. It is massive, productive and transformative. It is already making a significant contribution to Nigeria’s economy through its impact on foreign reserves, the balance of payments and the lives of ordinary Nigerians,” he said.
The Group Vice President for Oil and Gas at Dangote Industries Limited, Mr Devakumar Edwin, said the visit represented a significant milestone in a partnership that began during the refinery’s construction phase.
“The bank visited us during construction and understood the scale of what we were building,” Mr Edwin said. “Today, the refinery is fully operational, and they can see what their support has helped to create. It is like nurturing a tree and eventually seeing it bear fruit.”
He added that both organisations are exploring opportunities to deepen collaboration as Dangote expands its industrial footprint across Africa.
Also speaking, the chief executive of Dangote Petroleum Refinery, Mr David Bird, said the visit highlighted the importance of long-term partnerships in delivering large-scale industrial projects.
“Standard Bank has been one of our strongest supporters throughout the history of the refinery and the broader Dangote Group.
“This visit was an opportunity to demonstrate what that support has enabled. Seeing is believing, and it allows our partners to appreciate the scale of what has been achieved,” Mr Bird stated.
The visit also coincided with a major operational milestone for the refinery, which has now exceeded its original design capacity.
Mr Bird disclosed that the refinery recently completed performance test runs at 700,000 barrels per day, above its nameplate capacity of 650,000 barrels per day.
“We have always believed there was engineering flexibility built into the design,” he said. “Achieving sustained production of 700,000 barrels per day is a testament to the technical capability of our people and the strength of the systems we have built.”
By Adedapo Adesanya
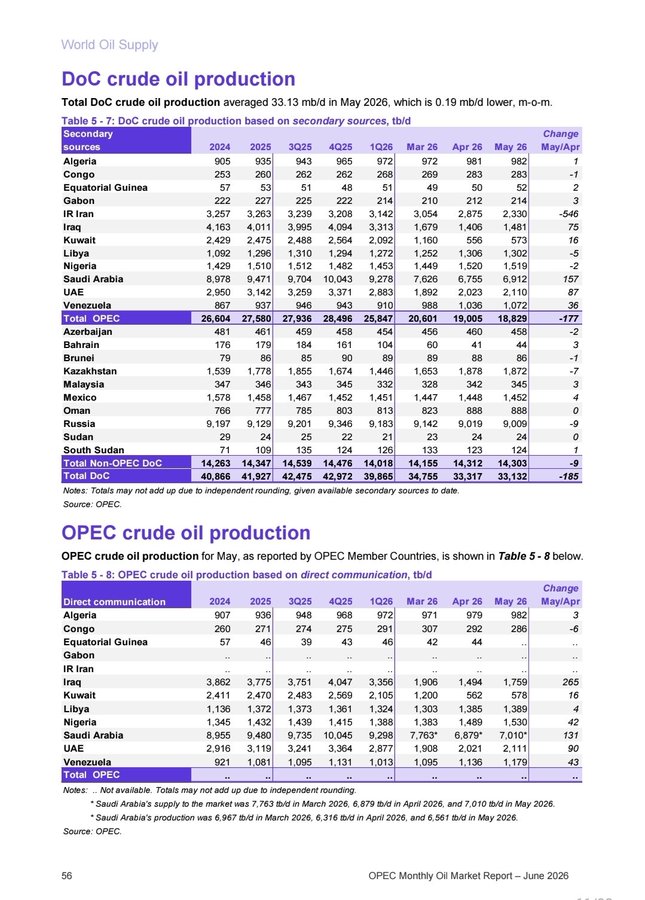
Nigeria produced about 1.530 million barrels of crude oil per day in May 2026, beating its Organisation of Petroleum Exporting Countries (OPEC) quota by 42,000 barrels per day. In the preceding month, the country only produced 1.489 million barrels per day.
In the latest OPEC’s Monthly Oil Market Report (MOMR), it was also revealed that Iraq in April supplied 1.494 million barrels per day while in May, it produced 1.759 million barrels per day, an increase 265,000 barrels per day; Saudi Arabia, 6.879 million barrels per day in April, 7.010 million barrels per day in May, an increase of 131,000 barrels per day; United Arab Emirate (UAE), 2.021 million barrels per day in April and in May 2.111 million barrels per day, an increase of 90,000 barrels per day while Venezuela, 1.136 million barrels per day in April and 1.179 million barrels per day in May, an increase of 43,000 barrels per day.
Using secondary sources, Nigeria’s production decreased from 1.520 million barrels per day in April to 1.519 million barrels per day; Saudi Arabia, 6.755 million barrels per day in April and 6.912 million barrels per day in May; UAE, 2.023 million barrels per day in April, 2.110 million barrels per day in May; and Venezuela, 1.036 million barrels per day in April and 1.072 million barrels per day in May.
Nigerian Upstream Petroleum Regulatory Commission (NUPRC), in a statement by its Head, Media and Corporate Communications, Mr Eniola Akinkuotu, confirmed that Nigeria, in May, met 102 per cent of OPEC quota as production hit an 11-month high.
According to it, Nigeria’s oil production witnessed an upswing in May 2026, averaging 1,530,354 barrels of crude oil and 170,446 barrels of condensates per day, bringing the total combined production to 1, 700, 800 barrels per day and consolidating Nigeria’s position as Africa’s largest oil producer.
It stated that the average crude oil production recorded in May represents 102 per cent of Nigeria’s 1.5mbpd of production quota allocated by OPEC.
It explained that production performance during the review period remained robust, with combined crude oil and condensate output ranging between a low of 1.51 million barrels per day and a peak of 1.86 million barrels per day.
The organisation added that the May 2026 production figures represented the highest recorded by Nigeria since July 2025, when output surged to 1,712,282.
NUPRC said: “In strict crude oil terms (excluding condensates), the 1.53 million barrels recorded in May 2026 represents the highest Nigeria has witnessed since January 2025 when crude oil production hit 1.538 mbpd.”
“On a month-on-month basis, production rose by 2.77 per cent in May 2026 as against 1.48mbpd in April. The broader production trend over the last five months has also remained positive.
“Combined crude oil and condensate output increased from 1.48 mbpd in February to 1.54 mbpd in March, 1.66 mbpd in April, and then 1.7 mbpd in May, underscoring sustained growth in Nigeria’s hydrocarbon production levels.
“Among production streams, Bonny Terminal led the pack with a total blend of 293,870 bpd, closely followed by Forcados Terminal at 289,900 bpd. Qua Iboe ranked third with 173,360 bpd, while Escravos Oil Terminal contributed 135,470 bpd. Odudu (Amenam Blend) completed the top five production streams, accounting for 63,250 bpd during the month under review.”
The commission attributed the rise in production to a sustained positive momentum as operations remained stable throughout the reporting period with no significant pipeline or facility outages recorded.
-
 Feature/OPED6 years ago
Davos was Different this year
-
Travel/Tourism10 years ago
Lagos Seals Western Lodge Hotel In Ikorodu
-

 Showbiz3 years ago
Estranged Lover Releases Videos of Empress Njamah Bathing
-
 Banking8 years ago
Sort Codes of GTBank Branches in Nigeria
-

 Economy3 years ago
Subsidy Removal: CNG at N130 Per Litre Cheaper Than Petrol—IPMAN
-
 Banking3 years ago
Sort Codes of UBA Branches in Nigeria
-

 Banking3 years ago
First Bank Announces Planned Downtime
-

 Sports3 years ago
Highest Paid Nigerian Footballer – How Much Do Nigerian Footballers Earn