Economy
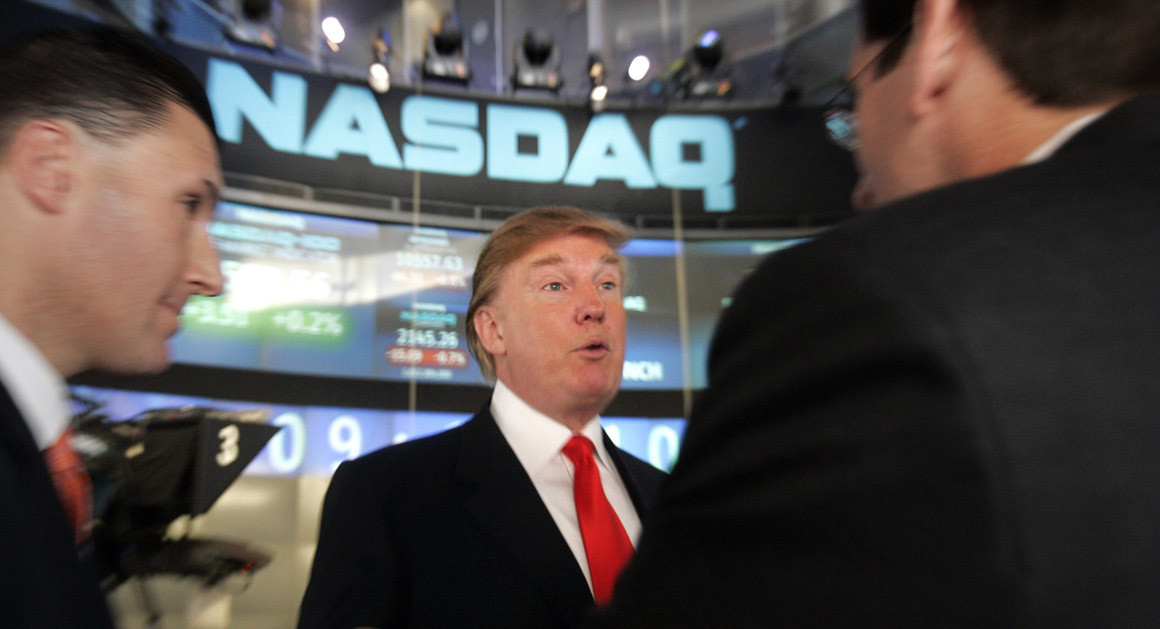
Wall Street Opens Higher on Rate Cut Optimism
By Investors Hub
The major U.S. index futures are pointing to a higher opening on Thursday, with stocks likely to rebound following the modest pullback seen over the two previous sessions.
A report from the Labor Department showing bigger than expected decreases in U.S. import and export prices may add to recent optimism that tame inflation will lead the Federal Reserve to cut interest rates in the near future.
After helping to lead the markets lower in the previous sessions, energy stocks may rebound along with the price of crude oil.
Crude for July delivery is jumping by more than $2 a barrel amid reports of a possible terrorist attack on oil tankers in the Gulf of Oman near the Iranian coastline.
Stocks turned in a relatively lackluster performance during trading on Wednesday before ending the session modestly lower. The major averages added to the slim losses posted on Tuesday, although selling pressure remained subdued.
After snapping a six-day winning streak on Tuesday, the Dow edged down 43.68 points or 0.2 percent to 26,004.83. The tech-heavy Nasdaq fell 29.85 points or 0.4 percent to 7,792.72 and the S&P 500 dipped 5.88 points or 0.2 percent to 2,879.84.
The modest weakness on Wall Street came as traders weighed lingering trade concerns against optimism about an interest rate cut by the Federal Reserve.
The U.S.-China trade conflict largely took a back seat to President Donald Trump’s threatened tariffs on Mexico but has moved back into the spotlight ahead of the G20 summit later this month.
In remarks to reporters on Tuesday, Trump suggested he has “no interest” in negotiating unless China agrees to come back to the table to discuss previous terms of a deal he has claimed was nearly complete.
Trump said he expects to meet with Chinese President Xi Jinping at the G20 summit and has warned that he will impose new tariffs on Chinese goods if his counterpart does not attend.
Partly offsetting the negative sentiment about trade, another report showing tame inflation has further fueled expectations that the Federal Reserve will cut interest rates in the near future.
The Labor Department said its consumer price index inched up by 0.1 percent in May after rising by 0.3 percent in April. The uptick in prices matched economist estimates.
Excluding food and energy prices, core consumer prices also edged up by 0.1 percent for the fourth consecutive month. Economists had expected core prices to rise by 0.2 percent.
The report also showed a slowdown in the annual rate of consumer price growth, with the headline index up by 1.8 percent year-over-year in May compared to the 2.0 percent increase in April.
The annual rate of core consumer price growth also slowed to 2.0 percent in May from 2.1 percent in the previous month.
“Tariff changes may eventually push up some goods prices, while apparel prices should soon rebound,” said ING Chief International Economist James Knightley. “But for now, inflation pressures in aggregate remain benign.”
He added, “As such, financial markets will see little reason for the Federal Reserve to hold back from rate cuts in coming months to combat the perceived threat of a slowdown caused by intensifying trade tensions.”
Energy stocks moved sharply lower over the course of the session, dragged down by a steep drop by the price of crude oil.
Reflecting the weakness in the energy sector, the Philadelphia Oil Service Index plummeted by 5.1 percent, the NYSE Arca Natural Gas Index tumbled by 3 percent and the NYSE Arca Oil Index slumped by 1.4 percent.
Considerable weakness also emerged among semiconductor stocks, as reflected by the 2.3 percent nosedive by the Philadelphia Semiconductor Index.
Financial, tobacco, and computer hardware stocks also saw notable weakness on the day, while significant strength was visible among gold, utilities and pharmaceutical stocks.


By Adedapo Adesanya
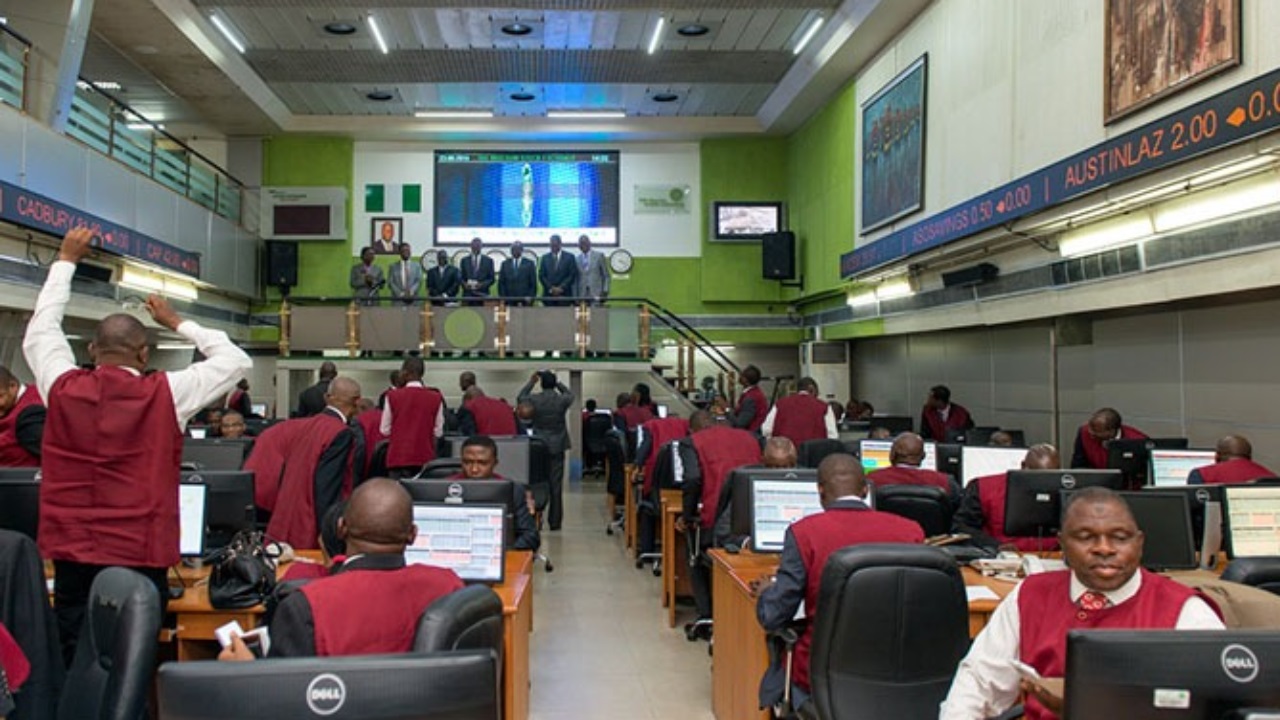
The price of the crude oil benchmarks moderated by about 3 per cent on Thursday on investor hopes for an end to the United States-Israeli war with Iran that could reopen the Strait of Hormuz, following a ceasefire deal between Israel and Lebanon.
Brent futures lost $2.78 or 2.84 per cent to trade at $95.03 per barrel, while the US West Texas Intermediate (WTI) crude declined by $2.98 or 3.1 per cent to close at $93.04 per barrel.
Israel and Lebanon said they have agreed to implement a ceasefire on Wednesday, raising hopes for a deal between the US and Iran. Iran has made any agreement conditional in part on an end to fighting between Israel and Hezbollah, an Iran-aligned group in Lebanon. However, Israeli strikes in southern Lebanon continued on Thursday.
Iran signalled that there has been “no tangible progress” in the talks with the Americans on a potential deal, while the Israel-Lebanon ceasefire announced by the United States overnight appears shaky.
“No tangible progress has been achieved in the negotiation process,” Iran’s Foreign Minister Abbas Araghchi was quoted as saying by the semi-official Iranian news agency Tasnim.
The US and Iran have been exchanging messages on a framework proposal for a potential agreement for weeks. The oil market has reacted to each signal or hint of a breakthrough with sell-offs that sent Brent Crude prices to below $100 per barrel last week.
Despite the market hopes, the positions of the two sides appear to remain very distant, and a re-opening of the Strait of Hormuz is not imminent.
Earlier this week, Iran targeted civilian infrastructure in Kuwait and Bahrain, and alarms were raised at US military bases in Saudi Arabia, as Iran responded to the Israeli offensive in Lebanon.
The Republican-led US House of Representatives approved a resolution to block President Donald Trump from continuing the war against Iran. To take effect, the resolution would need Senate approval and a two-thirds majority in both chambers to override an almost certain Trump veto.
The Organisation of the Petroleum Exporting Countries (OPEC) expects robust oil demand growth and is not changing its estimate, according to its Secretary General, Haitham Al Ghais, on Thursday.

By Adedapo Adesanya
Dangote Petroleum Refinery & Petrochemicals has increased its crude oil processing capacity to 700,000 barrels per day, exceeding its nameplate capacity of 650,000 barrels per day, reinforcing its position as the world’s largest single-train petroleum refinery.
The milestone was achieved during a performance test conducted by the refinery’s process licensors, highlighting the facility’s operational efficiency and ability to process additional feedstock while optimising output across its production units.
Vice President, Oil and Gas, Dangote Industries Limited, Mr Devakumar Edwin, said the increase forms part of a broader expansion strategy aimed at raising the refinery’s capacity to 1.4 million barrels per day within the next 30 months.
According to him, the planned expansion is expected to strengthen Nigeria’s energy security, eliminate dependence on imported refined petroleum products and position the country as a major regional export hub.
Mr Edwin noted that the refinery’s growth trajectory reflects ambitions that extend beyond meeting domestic demand, with a focus on establishing continental and global refining leadership.
The refinery, owned by billionaire Aliko Dangote, began fuel production in 2024 and has since scaled up output of petrol, diesel and jet fuel.
It supplies domestic markets and exports to African countries and Europe, including the United Kingdom, France and the Netherlands, while also shipping products to the United States and Saudi Arabia.
The refinery has also supplied petrol (called gasoline) to the United States and jet fuel to Saudi Arabia, further expanding its global footprint.
Dangote Refinery’s growing output has strengthened its role in stabilising fuel supply across Africa, particularly amid disruptions linked to geopolitical tensions in the Middle East. Industry observers say the facility has increasingly become a key source of energy security for several African nations.
Recall that Dangote Petroleum Refinery emerged as the world’s largest exporter of jet fuel in April, according to S&P Global Commodities.
The refinery has also contributed to reducing Nigeria’s dependence on imported fuel, easing pressure on foreign exchange reserves and supporting broader efforts to maximise value from the country’s crude oil resources.
Growing production levels have attracted interest from global crude suppliers and commodity trading firms, with the refinery sourcing feedstock from both domestic and international producers to sustain rising output.
Looking ahead, Dangote has outlined plans to transform the facility into the world’s largest refinery by 2028, with a targeted processing capacity of 1.4 million barrels per day.
The expansion is expected to generate significant economic benefits through increased industrial activity, job creation, export earnings and improved trade balances.
Beyond fuels, the refinery is also expected to strengthen downstream manufacturing through the supply of liquefied petroleum gas (LPG), polypropylene and other industrial feedstocks used in the production of packaging materials, consumer goods and detergents. Future plans also include the production of Linear Alkylbenzene (LAB), a key raw material in detergent manufacturing.
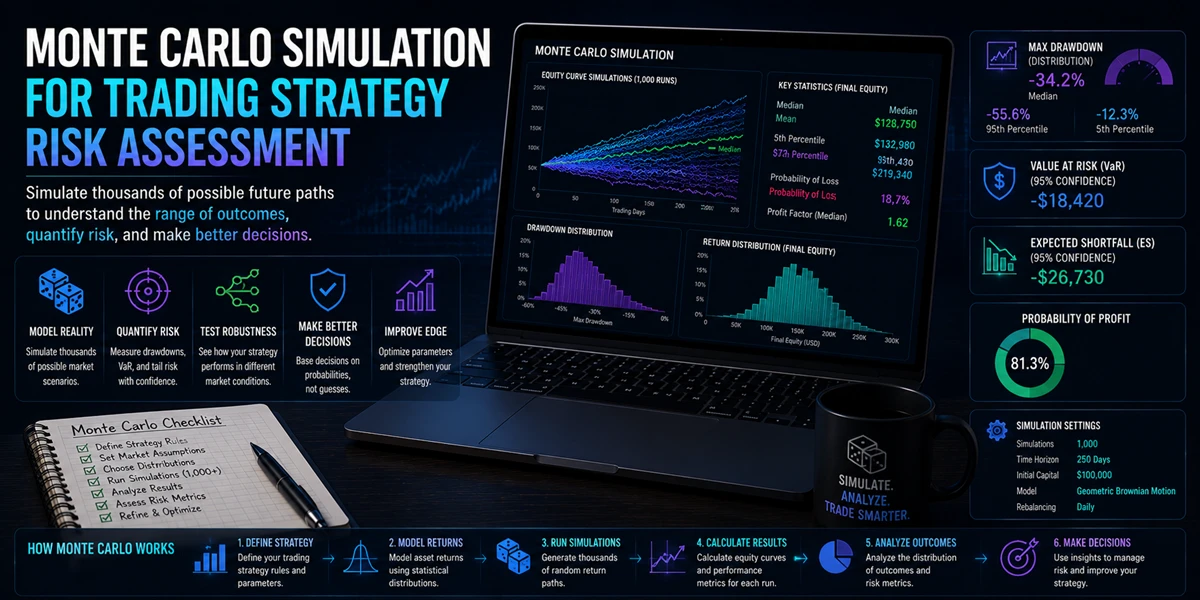
Most traders evaluate a strategy by looking at its historical performance.
Common metrics such as total return, win rate, profit factor, maximum drawdown, and Sharpe ratio provide valuable information about how a strategy performed in the past.
The problem is that historical performance tells only one story.
Financial markets are inherently uncertain. Even a strategy with an impressive backtest can experience very different outcomes once it encounters changing market conditions, unexpected volatility, or an unfavorable sequence of trades.
This is why professional traders, quantitative researchers, and portfolio managers increasingly rely on Monte Carlo simulation as part of their risk assessment process.
Rather than focusing on a single historical outcome, Monte Carlo analysis explores thousands of possible scenarios, helping traders understand what could happen—not just what already happened.
Why Historical Performance Is Only Part Of The Picture
Backtesting remains one of the most important tools in strategy development.
Platforms such as MetaTrader 5 provide sophisticated testing environments that allow traders to evaluate Expert Advisors and trading systems using historical market data.
A typical backtest may show:
| Metric | Result |
|---|---|
| Net Profit | 35% |
| Win Rate | 54% |
| Maximum Drawdown | 12% |
At first glance, these numbers appear encouraging.
However, every backtest contains one important limitation:
History occurred only once.
The strategy followed a specific sequence of winning and losing trades. If those same trades had occurred in a different order, the overall experience could have looked very different.
This is where Monte Carlo analysis becomes valuable.
Understanding Sequence Risk
One of the most important concepts in Monte Carlo simulation is sequence risk.
Consider a simple series of trades:
| Trade | Result |
|---|---|
| 1 | +3% |
| 2 | +2% |
| 3 | -1% |
| 4 | +4% |
| 5 | -2% |
The overall result is positive.
However, if those same trades occurred in a different order:
| Trade | Result |
|---|---|
| 1 | -2% |
| 2 | -1% |
| 3 | +2% |
| 4 | +3% |
| 5 | +4% |
the final return may remain similar while the path becomes significantly more difficult.
The trader may experience:
- Larger drawdowns
- Longer recovery periods
- Increased psychological pressure
- Greater capital requirements
The strategy itself has not changed.
Only the sequence has changed.
Monte Carlo simulation explores thousands of these alternative scenarios to estimate how different trade sequences may influence future performance.
Exploring Thousands Of Possible Outcomes
Monte Carlo analysis works by generating large numbers of alternative outcomes based on historical strategy behavior.
A simplified process looks like this:
Historical Trade Results
        ↓
    Randomization
        ↓
     Simulation
        ↓
Repeat Thousands of Times
        ↓
    Risk Analysis
Each simulation represents a plausible alternative version of history.
By repeating this process thousands of times, traders can estimate:
- Potential drawdowns
- Losing streak probabilities
- Capital requirements
- Performance variability
- Confidence intervals
The objective is not to predict the future.
The objective is to understand uncertainty.
Looking Beyond Average Returns
Many traders focus heavily on expected returns.
Risk professionals often focus on worst-case outcomes.
Consider two strategies:
| Metric | Strategy A | Strategy B |
|---|---|---|
| Average Return | 20% | 20% |
| Historical Drawdown | 10% | 10% |
At first glance, they appear nearly identical.
Monte Carlo analysis may reveal a different story:
| Risk Metric | Strategy A | Strategy B |
|---|---|---|
| Worst Simulated Drawdown | 18% | 35% |
| Probability of 20% Drawdown | 5% | 27% |
Although historical results appear similar, future risk characteristics may differ significantly.
This is one reason why institutional investors rarely rely solely on traditional backtest statistics.
The Reality Of Losing Streaks
One of the most underestimated aspects of trading is the impact of consecutive losses.
Even profitable strategies can experience difficult periods.
For example:
| Consecutive Trades |
|---|
| Loss |
| Loss |
| Loss |
| Loss |
| Loss |
| Loss |
Such sequences are completely normal.
However, they often create emotional pressure and lead traders to abandon otherwise profitable systems.
Monte Carlo analysis helps estimate:
- Expected losing streak lengths
- Worst-case losing streaks
- Probability of extended downturns
- Recovery requirements
Understanding these possibilities allows traders to set more realistic expectations before real capital is exposed.
Position Sizing And Capital Preservation
Position sizing is one of the most important applications of Monte Carlo analysis.
Even profitable strategies can fail if risk per trade is too aggressive.
Monte Carlo simulations help answer questions such as:
- How much capital is required?
- What position size is sustainable?
- What drawdown level is acceptable?
- What is the probability of account depletion?
For example, a strategy may appear relatively safe at 1% risk per trade.
The same strategy may exhibit a significant probability of severe drawdowns when risk increases to 5% per trade.
Understanding these relationships often leads to better risk-management decisions.
Portfolio Risk And Diversification
Monte Carlo simulation is not limited to individual strategies.
Portfolio managers frequently use it to evaluate:
- Multi-strategy portfolios
- Multi-asset portfolios
- Diversification effects
- Correlation risks
A portfolio may appear well diversified based on historical data.
However, asset relationships can change unexpectedly during periods of market stress.
Monte Carlo analysis helps traders evaluate how portfolios may behave under alternative scenarios rather than relying solely on historical observations.
Randomness Plays A Bigger Role Than Most Traders Realize
One of the most important lessons of Monte Carlo analysis is that randomness influences results more than many traders expect.
A profitable strategy can experience:
- Unfavorable timing
- Extended drawdowns
- Long losing streaks
- Temporary underperformance
without any deterioration in the underlying strategy.
Understanding this distinction helps traders separate:
| Normal Statistical Variation | Genuine Strategy Problems |
|---|---|
| Temporary drawdowns | Structural performance decline |
| Random losing streaks | Broken trading logic |
| Short-term underperformance | Changing market assumptions |
This perspective is essential for long-term strategy management.
Monte Carlo As Part Of A Complete Validation Process
Monte Carlo analysis works best when combined with other research methods.
Many professional workflows follow a process similar to:
| Step | Process |
|---|---|
| 1 | Strategy Development |
| 2 | Historical Backtesting |
| 3 | Optimization |
| 4 | Monte Carlo Analysis |
| 5 | Forward Testing |
| 6 | Deployment |
| 7 | Ongoing Monitoring |
The broader MetaTrader ecosystem supports many stages of this workflow through strategy testing, optimization, algorithmic development, and performance analysis tools.
The objective is not simply to find profitable strategies.
The objective is to understand how those strategies may behave when market conditions become less favorable.
Why Professional Firms Use Monte Carlo Analysis
Institutional investment firms focus on risk as much as return.
Their goal is not only to identify profitable opportunities but also to understand:
- Capital requirements
- Worst-case scenarios
- Portfolio resilience
- Survival probabilities
These considerations become increasingly important as capital allocations grow larger.
The same principles can benefit independent traders.
A strategy with slightly lower returns but substantially lower risk may ultimately prove more sustainable over the long term.
Understanding Risk Beyond The Backtest
Historical performance provides valuable information, but it tells only part of the story.
Monte Carlo simulation helps traders explore the uncertainty that exists beyond a single backtest result. By generating thousands of alternative scenarios, the technique provides insight into drawdowns, losing streaks, capital requirements, and portfolio resilience.
As algorithmic trading becomes increasingly sophisticated, risk assessment is becoming just as important as strategy development itself.
The most successful traders are often not those who find the highest returns.
They are those who understand the risks behind those returns and prepare for outcomes that may never appear in a traditional backtest.
In modern quantitative trading, understanding uncertainty can be just as valuable as identifying opportunity.
-
 Feature/OPED6 years ago
Davos was Different this year
-
Travel/Tourism10 years ago
Lagos Seals Western Lodge Hotel In Ikorodu
-

 Showbiz3 years ago
Estranged Lover Releases Videos of Empress Njamah Bathing
-
 Banking8 years ago
Sort Codes of GTBank Branches in Nigeria
-

 Economy3 years ago
Subsidy Removal: CNG at N130 Per Litre Cheaper Than Petrol—IPMAN
-

 Banking3 years ago
Sort Codes of UBA Branches in Nigeria
-

 Banking3 years ago
First Bank Announces Planned Downtime
-

 Sports3 years ago
Highest Paid Nigerian Footballer – How Much Do Nigerian Footballers Earn