

Economy
Monte Carlo Simulation for Trading Strategy Risk Assessment

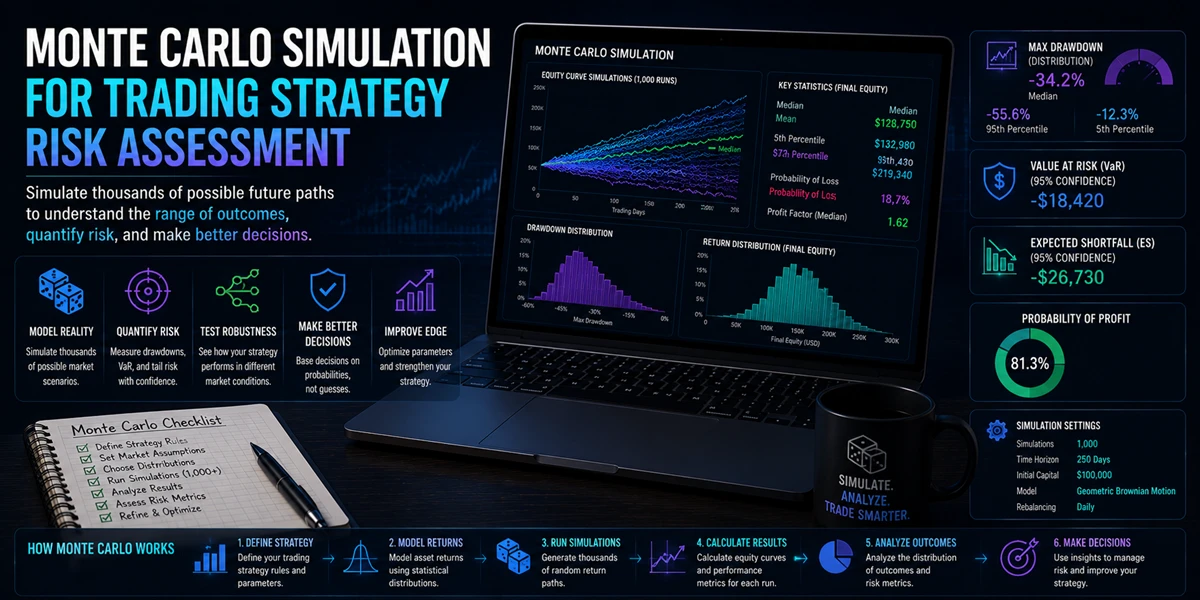
Most traders evaluate a strategy by looking at its historical performance.
Common metrics such as total return, win rate, profit factor, maximum drawdown, and Sharpe ratio provide valuable information about how a strategy performed in the past.
The problem is that historical performance tells only one story.
Financial markets are inherently uncertain. Even a strategy with an impressive backtest can experience very different outcomes once it encounters changing market conditions, unexpected volatility, or an unfavorable sequence of trades.
This is why professional traders, quantitative researchers, and portfolio managers increasingly rely on Monte Carlo simulation as part of their risk assessment process.
Rather than focusing on a single historical outcome, Monte Carlo analysis explores thousands of possible scenarios, helping traders understand what could happen—not just what already happened.
Why Historical Performance Is Only Part Of The Picture
Backtesting remains one of the most important tools in strategy development.
Platforms such as MetaTrader 5 provide sophisticated testing environments that allow traders to evaluate Expert Advisors and trading systems using historical market data.
A typical backtest may show:
| Metric | Result |
|---|---|
| Net Profit | 35% |
| Win Rate | 54% |
| Maximum Drawdown | 12% |
At first glance, these numbers appear encouraging.
However, every backtest contains one important limitation:
History occurred only once.
The strategy followed a specific sequence of winning and losing trades. If those same trades had occurred in a different order, the overall experience could have looked very different.
This is where Monte Carlo analysis becomes valuable.
Understanding Sequence Risk
One of the most important concepts in Monte Carlo simulation is sequence risk.
Consider a simple series of trades:
| Trade | Result |
|---|---|
| 1 | +3% |
| 2 | +2% |
| 3 | -1% |
| 4 | +4% |
| 5 | -2% |
The overall result is positive.
However, if those same trades occurred in a different order:
| Trade | Result |
|---|---|
| 1 | -2% |
| 2 | -1% |
| 3 | +2% |
| 4 | +3% |
| 5 | +4% |
the final return may remain similar while the path becomes significantly more difficult.
The trader may experience:
- Larger drawdowns
- Longer recovery periods
- Increased psychological pressure
- Greater capital requirements
The strategy itself has not changed.
Only the sequence has changed.
Monte Carlo simulation explores thousands of these alternative scenarios to estimate how different trade sequences may influence future performance.
Exploring Thousands Of Possible Outcomes
Monte Carlo analysis works by generating large numbers of alternative outcomes based on historical strategy behavior.
A simplified process looks like this:
Historical Trade Results
        ↓
    Randomization
        ↓
     Simulation
        ↓
Repeat Thousands of Times
        ↓
    Risk Analysis
Each simulation represents a plausible alternative version of history.
By repeating this process thousands of times, traders can estimate:
- Potential drawdowns
- Losing streak probabilities
- Capital requirements
- Performance variability
- Confidence intervals
The objective is not to predict the future.
The objective is to understand uncertainty.
Looking Beyond Average Returns
Many traders focus heavily on expected returns.
Risk professionals often focus on worst-case outcomes.
Consider two strategies:
| Metric | Strategy A | Strategy B |
|---|---|---|
| Average Return | 20% | 20% |
| Historical Drawdown | 10% | 10% |
At first glance, they appear nearly identical.
Monte Carlo analysis may reveal a different story:
| Risk Metric | Strategy A | Strategy B |
|---|---|---|
| Worst Simulated Drawdown | 18% | 35% |
| Probability of 20% Drawdown | 5% | 27% |
Although historical results appear similar, future risk characteristics may differ significantly.
This is one reason why institutional investors rarely rely solely on traditional backtest statistics.
The Reality Of Losing Streaks
One of the most underestimated aspects of trading is the impact of consecutive losses.
Even profitable strategies can experience difficult periods.
For example:
| Consecutive Trades |
|---|
| Loss |
| Loss |
| Loss |
| Loss |
| Loss |
| Loss |
Such sequences are completely normal.
However, they often create emotional pressure and lead traders to abandon otherwise profitable systems.
Monte Carlo analysis helps estimate:
- Expected losing streak lengths
- Worst-case losing streaks
- Probability of extended downturns
- Recovery requirements
Understanding these possibilities allows traders to set more realistic expectations before real capital is exposed.
Position Sizing And Capital Preservation
Position sizing is one of the most important applications of Monte Carlo analysis.
Even profitable strategies can fail if risk per trade is too aggressive.
Monte Carlo simulations help answer questions such as:
- How much capital is required?
- What position size is sustainable?
- What drawdown level is acceptable?
- What is the probability of account depletion?
For example, a strategy may appear relatively safe at 1% risk per trade.
The same strategy may exhibit a significant probability of severe drawdowns when risk increases to 5% per trade.
Understanding these relationships often leads to better risk-management decisions.
Portfolio Risk And Diversification
Monte Carlo simulation is not limited to individual strategies.
Portfolio managers frequently use it to evaluate:
- Multi-strategy portfolios
- Multi-asset portfolios
- Diversification effects
- Correlation risks
A portfolio may appear well diversified based on historical data.
However, asset relationships can change unexpectedly during periods of market stress.
Monte Carlo analysis helps traders evaluate how portfolios may behave under alternative scenarios rather than relying solely on historical observations.
Randomness Plays A Bigger Role Than Most Traders Realize
One of the most important lessons of Monte Carlo analysis is that randomness influences results more than many traders expect.
A profitable strategy can experience:
- Unfavorable timing
- Extended drawdowns
- Long losing streaks
- Temporary underperformance
without any deterioration in the underlying strategy.
Understanding this distinction helps traders separate:
| Normal Statistical Variation | Genuine Strategy Problems |
|---|---|
| Temporary drawdowns | Structural performance decline |
| Random losing streaks | Broken trading logic |
| Short-term underperformance | Changing market assumptions |
This perspective is essential for long-term strategy management.
Monte Carlo As Part Of A Complete Validation Process
Monte Carlo analysis works best when combined with other research methods.
Many professional workflows follow a process similar to:
| Step | Process |
|---|---|
| 1 | Strategy Development |
| 2 | Historical Backtesting |
| 3 | Optimization |
| 4 | Monte Carlo Analysis |
| 5 | Forward Testing |
| 6 | Deployment |
| 7 | Ongoing Monitoring |
The broader MetaTrader ecosystem supports many stages of this workflow through strategy testing, optimization, algorithmic development, and performance analysis tools.
The objective is not simply to find profitable strategies.
The objective is to understand how those strategies may behave when market conditions become less favorable.
Why Professional Firms Use Monte Carlo Analysis
Institutional investment firms focus on risk as much as return.
Their goal is not only to identify profitable opportunities but also to understand:
- Capital requirements
- Worst-case scenarios
- Portfolio resilience
- Survival probabilities
These considerations become increasingly important as capital allocations grow larger.
The same principles can benefit independent traders.
A strategy with slightly lower returns but substantially lower risk may ultimately prove more sustainable over the long term.
Understanding Risk Beyond The Backtest
Historical performance provides valuable information, but it tells only part of the story.
Monte Carlo simulation helps traders explore the uncertainty that exists beyond a single backtest result. By generating thousands of alternative scenarios, the technique provides insight into drawdowns, losing streaks, capital requirements, and portfolio resilience.
As algorithmic trading becomes increasingly sophisticated, risk assessment is becoming just as important as strategy development itself.
The most successful traders are often not those who find the highest returns.
They are those who understand the risks behind those returns and prepare for outcomes that may never appear in a traditional backtest.
In modern quantitative trading, understanding uncertainty can be just as valuable as identifying opportunity.