
Economy
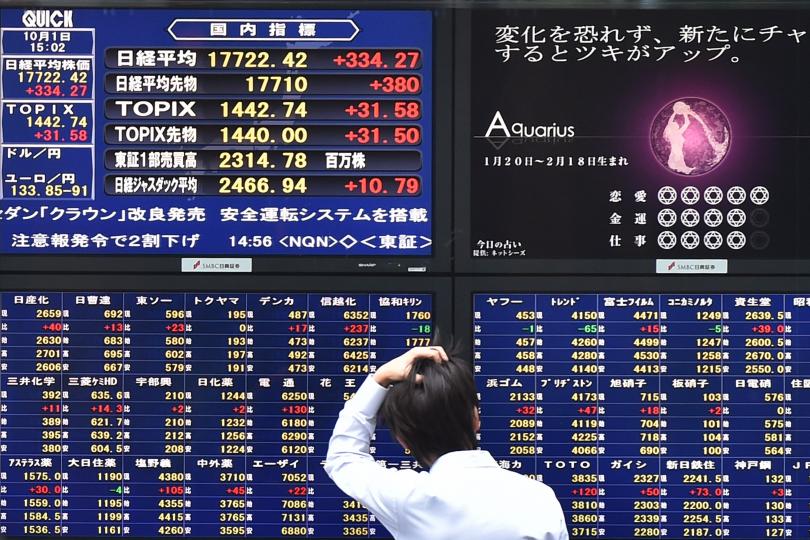
Asian Stock Markets Surge as Investors React to Korean Peace Move
By Investors Hub
Asian stocks closed broadly higher on the last trading day of the month as tensions on the Korean Peninsula faded and investors digested a slew of earnings releases and economic reports.
The dollar held below three-month highs amid a pullback in Treasury yields and ahead of the Fed’s policy decision and a jobs report due this week, while oil prices slipped as investors waited for signs on whether the U.S. would re-impose sanctions on Iran. Trading volumes remained thin across Asia amid holidays in China and Japan.
Investors shrugged off official data from China showing that the country’s manufacturing sector grew at a slower pace in April. The official manufacturing PMI fell slightly to 51.4 in April from 51.5 in March. However, the non-manufacturing PMI that covers services and construction, improved to 54.8 from 54.6 a month ago.
Hong Kong’s Hang Seng Index jumped 527.78 points or 1.7 percent to 30,808.45 after the leaders of North and South Korea vowed “complete denuclearization” and U.S. Secretary of State Mike Pompeo said the U.S. has an “obligation” to pursue a diplomatic solution with North Korea.
Australian shares rose as financials and property developers gained ground, offsetting losses in the mining sector on weaker commodity prices.
The benchmark S&P/ASX 200 Index rose 29.10 points or 0.5 percent to 5,982.70, while the broader All Ordinaries Index ended up 28.70 points or 0.5 percent at 6,071.60.
Wealth manager AMP rose half a percent following recent heavy losses after its chairwoman resigned amid a widening scandal. ANZ, NAB and Westpac rose between 0.8 percent and 1.3 percent ahead of the Reserve Bank of Australia’s monetary policy decision on Tuesday.
Realty firm Stockland Corporation rallied 3.2 percent after reaffirming its fiscal year 2017 guidance. Goodman Group Pty advanced 1.2 percent.
Power producer AGL Energy added 1.3 percent after it received a non-binding, highly conditional $250 million offer to acquire the Liddell coal-fired power station.
Miners BHP Billiton and South 32 dropped half a percent and 0.3 percent, respectively, while BlueScope Steel fell over 2 percent to register its biggest intraday percentage loss in nearly four weeks.
Seoul stocks rallied to close near three-month highs after Friday’s summit between the leaders of the two Koreas concluded. The benchmark Kospi climbed 22.98 points or 0.9 percent to finish at 2,515.38, the highest closing level since February 2nd.
South Korean industrial production fell 4.3 percent year-over-year in March, slower than the 6.8 percent decline in February, preliminary data showed. Economists had expected a 1.6 percent drop for the month.

By Adedapo Adesanya
The National Pension Commission (PenCom) has defended its decision to allow Pension Fund Administrators (PFAs) to invest in the parent companies of their custodians, insisting that adequate safeguards are in place to protect contributors’ funds.
The director-general of the pension regulator, Ms Omolola Oloworaran, speaking on Tuesday during the Meet the Press Briefing at the Presidential Villa, Abuja, said the commission’s decision to relax the investment restriction followed a comprehensive risk assessment that found minimal conflict of interest.
She explained that under PenCom’s investment regulations, PFAs are only permitted to invest pension assets in carefully selected instruments that meet stringent criteria, including profitability, strong credit ratings and proven track records.
According to her, the commission regularly reviews its investment regulations, conducts routine examinations and spot checks on PFAs to ensure strict compliance with established risk management guidelines.
“PFAs cannot just go into the stock market and buy any kind of stock. There are strict guidelines. Companies must demonstrate profitability, have a proven track record and satisfy other criteria before pension funds can invest,” she said.
Ms Oloworaran noted that each PFA also operates under the oversight of a board, an investment committee and a risk management committee, providing additional layers of governance to safeguard contributors’ funds.
She said PenCom recently issued a circular allowing PFAs to invest in the parent companies of their custodians after determining that the potential conflict of interest was negligible.
The PenCom boss explained that the parent companies involved are largely Tier-1 banks, including First Bank, United Bank for Africa (UBA) and Zenith Bank, which she described as A-rated institutions with strong financial foundations.
She said the policy was intended to widen investment opportunities for pension funds without compromising safety.
Using Stanbic IBTC as an example, Ms Oloworaran explained that if its custodian is Zenith Bank, the previous restriction prevented the pension administrator from investing in Zenith Bank shares despite the bank’s strong performance.
“We reviewed the risks and any potential conflict of interest and found the risks to be very low. That is why we opened that investment window,” she said.
By Aduragbemi Omiyale
Analysts at Meristem Research have predicted that the inflation rate for June 2026 in Nigeria should marginally rise to 15.95 per cent on a year-on-year basis from the 15.93 per cent reported in May 2026.
The National Bureau of Statistics (NBS) is expected to release inflation numbers for last month later today, Wednesday, July 15, 2026.
In its report sighted by Business Post, Meristem Research said it expects inflationary pressures to re-emerge across key economies in the near term, as the re-escalation of the US-Iran conflict has reignited upward pressure on global oil prices.
It disclosed that this marks a sharp reversal from most of June, when the ceasefire between the two countries helped drive oil prices lower, raising expectations of some relief on the inflation front.
With conflicts now flaring up again, oil prices are likely to increase again, and the anticipated easing in energy-driven inflation may not materialise as broadly as earlier envisaged.
“Nonetheless, some relief is likely from the food segment, where robust supply conditions across major producing regions and softening demand should continue to ease food price pressures,” it stated.
The team also explained that it projected a 15.95 per cent inflation rate because of the lingering effects of persistent food price pressures.
“However, we expect core inflation to moderate as the sharp reversal in energy prices begins to filter through to transportation, distribution, and other energy-related costs, easing underlying price pressures.
“On a month-on-month basis, the combined effect of lower petrol prices, a relatively stable Naira, and the gradual pass-through of reduced energy costs across the supply chain should exert further downward pressure on inflation.
“Based on our assessment, food inflation is expected to remain the key swing factor, as seasonal pre-harvest supply constraints are likely to offset some of the gains from lower logistics costs,” it said.

By Adedapo Adesanya
The duo of Central Securities Clearing System (CSCS) Plc and Afriland Properties Plc weakened the NASD Over-the-Counter (OTC) Securities Exchange by 1.61 per cent on Tuesday, July 14.
CSCS Plc saw its stock value drop N9.08 to close at N82.40 per share compared with the preceding session’s N91.48 per share, and Afriland Properties Plc slid by 17 Kobo to sell at N15.00 per unit versus N15.70 per unit.
The losses recorded by the two securities pulled back the market capitalisation by N41.64 billion to N2.546 trillion from N2.587 trillion, and cracked the NASD Security Index (NSI) by 69.36 points to 4,242.31 points from 4,311.67 points.
It was observed that the exchange witnessed two price advancers during the session, led by FrieslandCampina Wamco Nigeria Plc, which gained N1.37 to end at N151.37 per share compared with the previous day’s N150.00 per share, and Food Concepts Plc chalked up 5 Kobo to settle at N2.50 per unit versus N2.45 per unit.
The volume of securities traded by market participants surged by 50.7 per cent to 13.7 million units from the previous 9.1 million units, while the value of securities went down by 79.7 per cent to N65.2 million from N320.4 million, and the number of deals crashed by 3.6 per cent to 27 deals from the previous session’s 28 deals.
At the close of transactions, Great Nigeria Insurance (GNI) Plc remained the most traded stock by value on a year-to-date basis, with the sale of 3.4 billion units for N8.4 billion, trailed by Infrastructure Credit Guarantee (Infracredit) Plc, which exchanged 2.3 billion units valued at N6.5 billion, and CSCS Plc with 73.9 million units transacted for N5.2 billion.
GNI Plc also closed the trading day as the most traded stock by volume on a year-to-date basis, with 3.4 billion units worth N8.4 billion, followed by Infracredit Plc with 2.3 billion units traded for N6.5 billion, and Resourcery Plc with 1.1 billion units valued at N415.7 million.
