
Economy
Best Trading Monitors In 2023: Enhance Your Trading Performance
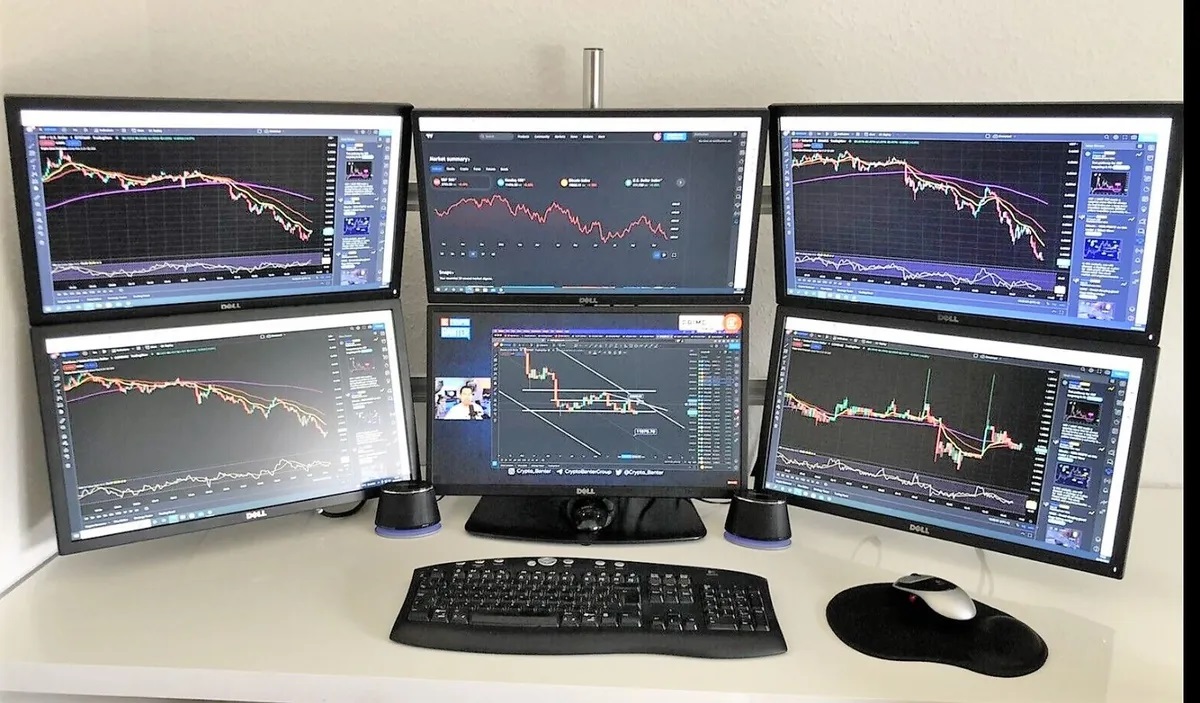
In order to trade effectively, you require the best brokerage, a reliable trading strategy, and a dependable output device. A top-notch trading monitor is essential for accessing critical trading information and staying updated on market patterns and economic conditions. Selecting the right monitor can significantly enhance your trading performance. Here, Traders Union experts explore the six best trading monitors for forex traders in 2023.
Best trading monitors
If you’re serious about trading, finding the best monitor for trading can significantly boost your performance and stay ahead in the markets. Discover top trading monitors that elevate your trading experience and help you achieve financial goals:
- Samsung CHG90 Series 49“ – Best trading monitor with an ultrawide screen
Pros: Quantum Dot Technology, reduced input lag and ghosting, excellent image quality, High Dynamic Range (HDR) integration.
Cons: Some users may find it expensive.
- Dell U4320Q
Pros: Picture-by-Picture feature for multitasking, auto-restore feature, supports multiple charts, 4K technology with Vesa interface.
Cons: Not suitable for novices, requires a sizable desk space.
- LG 34WN80C-B UltraWide Monitor
Pros: On-Screen control options, built-in speakers and sensors, excellent gradient handling, height adjustment feature.
Cons: Relatively high price considering its size.
- HP X27q 27″ WQHD
Pros: Wide viewing angles with AMD FreeSync Premium, vertical tilt and rotation options, thin edges for dual monitor setup.
Cons: Eye-ease coating lessens image quality, limited swivel options.
- ViewSonic 32 Inch 1080p Widescreen
Pros: Dividable screen with ViewSplit software, premium IPS panel for clear charts, bezel-free design.
Cons: Features could have been richer.
- Samsung J791
Pros: Intel Thunderbolt 3 display splitter, HDR support, 1 ms response time, wide horizontal workspace.
Cons: Poor viewing angles, potential glare issues.
Choose the right trading monitor that suits your preferences and enhances your trading performance.
How much does a trading monitor cost?
According to TU analysts, trading monitors come in a wide price range, from slightly above $100 to well beyond $2000, but most are priced between $200 and $500. In this range, you can find 1-2 monitors with exceptional features. If you’re new to trading, starting with budget-friendly monitors is recommended, and as you advance in your trading career, investing in high-quality monitors with configurations priced between $500 and $800 becomes a viable option.
Laptop vs Trading monitor
Analysts at Traders Union consider that it is important to recognize that both desktops and laptops have their merits for trading, but one may better suit a trader’s specific needs. Desktops excel in providing more processing power and built-in customization options, making them a top choice. On the other hand, laptops offer undeniable portability, allowing swing traders and long-term investors to access the necessary information from anywhere, providing flexibility.
However, when it comes to day trading, a desktop offers a significant advantage due to the abundance of data to scale and monitor. Setting up multiple screens becomes easier, and the quick and powerful nature of desktops is particularly beneficial for day traders. For optimal productivity and reliability in day trading, choosing the best trading monitor becomes essential. Check also the TU experts’ article about weekend trading on Forex which is very important.
How to choose the best day trading computers?
When considering the best trading monitor, the computer’s functionality becomes a crucial factor for optimal performance. Real-time data requires sufficient processing power to avoid missed trading opportunities. Here are essential system requirements for a successful trading experience:
- RAM: A minimum of 8 GB RAM is necessary for speed and adaptability. For multitasking, 16 GB or more is recommended.
- Processor Speed: A quad-core 2.8GHz processor (such as Intel i5 or i9) is preferred for quick operations.
- Hard Drive: Opt for a 250GB SSD hard drive for swift data storage, using the primary hard drive for reliability and a separate SSD drive solely for trading.
- Battery Life: Longer battery life (at least eight hours) is beneficial, especially for traders in areas with power issues or emergencies.
- Display: Choose a high-quality monitor to ensure clear images and top-notch performance in trading. Consider important factors when selecting screens for trading.
Conclusion
Having the right trading monitor is crucial for effective trading, providing access to critical information and enhancing performance. Traders Union analysts have explored the top trading monitors for forex traders in 2023, offering a range of options to suit different preferences and budgets.

By Dipo Olowookere
The Nigerian Exchange (NGX) Limited rebounded by 0.46 per cent on Tuesday despite continued weak investor sentiment due to low confidence in the market.
The gains recorded yesterday were largely impacted by significant trades in First Holdco by a major shareholder of the financial institution.
In terms of price gainers and losers, the bears won the race, as 28 equities closed in the red and 24 equities ended in the green, indicating a negative market breadth index.
Learn Africa grew by 10.00 per cent to N9.90, First Holdco expanded by 9.98 per cent to N72.15, Thomas Wyatt rose by 9.80 per cent to N2.69, RT Briscoe improved by 8.68 per cent to N13.15, and Transcorp Hotels increased by 8.37 per cent to N242.00.
Conversely, International Energy Insurance lost 9.86 per cent to close at N4.66, Legend Internet slipped by 9.18 per cent to N4.45, Fortis Global Insurance decreased by 7.67 per cent to N2.77, FTN Cocoa tumbled by 7.55 per cent to N8.21, and International Breweries dropped 4.79 per cent to trade at N13.90.
Business Post reports that First Holdco led the activity chart with a turnover of 326.9 million units worth N22.3 billion. GTCO traded 22.5 million units valued at N2.8 billion, Access Holdings transacted 18.5 million units for N461.6 million, FCMB sold 16.1 million units worth N166.8 million, and Zenith Bank exchanged 15.9 million units valued at N1.7 billion.
At the close of business, a total of 634.8 million stocks valued at N53.3 billion exchanged hands in 42,494 deals versus the 523.5 million stocks sold for N22.3 billion in 59,945 deals on Monday, indicating a shortfall in the number of deals by 29.11 per cent, and a surge in the trading volume and value by 21.26 per cent and 139.01 per cent, respectively.
The All-Share Index (ASI) was up during the trading day by 1,121.33 points to 242,870.44 points from 241,749.11 points, and the market capitalisation gained N719 billion to settle at N155.849 trillion compared with the previous day’s N155.130 trillion.
Market participants will be looking forward to the release of inflation data for June 2026 by the National Bureau of Statistics (NBS) today, Wednesday, July 15.

By Adedapo Adesanya
Oil prices climbed about 2 per cent to a one-month high on Tuesday after the US reportedly reimposed a naval blockade on Iran, which will reduce oil flows from the region through the Strait of Hormuz.
Brent futures rose by $1.43 or 1.7 per cent to settle at $84.73 per barrel, while the US West Texas Intermediate (WTI) crude increased by $1.20 or 1.5 per cent to $79.34 a barrel.
Brent closed at its highest since June 12, and WTI at its highest since June 15. The closing price increase kept Brent in technically overbought territory for a second day in a row for the first time since March.
Before the Iran war, about 20 per cent of global oil supplies flowed through the strait.
US President Donald Trump stepped back from a proposal to charge a 20 per cent fee to guard the Strait of Hormuz as part of the conflict with Iran, saying he would instead seek investment deals with Gulf states.
US forces had carried out waves of attacks for the third night after Iran said it had closed the strait. President Trump on Monday reinstated a blockade of Iranian shipping and proposed the fee, but hours before the fee was to take effect, the American President said the strait was open to all shipping traffic except that of Iran.
The renewed attacks have fed doubts that a memorandum of understanding signed last month will lead to a permanent halt in the war that has disrupted global energy supplies and stoked inflation fears.
Data showed that US consumer inflation slowed more than expected in June as energy prices retreated, but financial markets still expect an interest rate hike from the Federal Reserve.
The Federal Reserve Chairman Kevin Warsh on Tuesday vowed to “do my job” if challenged by President Trump, who has said he wants the US central bank to cut interest rates and boost economic growth.
The American Petroleum Institute (API) estimated that crude oil inventories in the US fell by 564,000 barrels in the week ending July 10. In the week prior, US crude oil inventories fell by 399,000 barrels.
Although commercial crude oil inventories excluding the SPR have been falling rapidly for three months now, shedding just over 60 million barrels over the last twelve weeks, US crude inventories are only down 9.2 million barrels so far this year. The US Energy Information Administration (EIA) will release its report later on Wednesday.
By Adedapo Adesanya
The 700,000 barrels per day Dangote Petroleum Refinery has begun pricing fuel products for the local market in US Dollars amid crude supply challenges.
The company cited difficulties securing sufficient crude under the government’s Naira-for-crude programme and rising global oil prices as reasons for the development.
The Naira-for-crude programme, launched in October 2024, allowed domestic refiners to purchase crude in the local currency and reduced pressure on the foreign exchange market.
Mr Edwin Devakumar, the vice president of the Dangote Group, said the refinery had been absorbing a currency mismatch by selling products in Naira while sourcing crude in Dollars, but limited crude supply under the Naira-for-crude programme had undermined the arrangement’s viability.
Dangote has now set the ex-depot price of petrol at $0.779 per litre, diesel at $1.087 per litre and aviation fuel at $0.942 per litre, according to a pricing template circulated to marketers.
Although the Nigerian National Petroleum Company (NNPC) Limited increased Dangote’s allocation to seven cargoes in May from about five previously, the refiner has said it requires 13 to 15 cargoes a month and has been forced to import the remainder at international prices.
The decision could boost demand for Dollars among fuel marketers and make domestic fuel prices more sensitive to exchange-rate fluctuations.
Dangote Refinery is steadily ramping up operations toward full capacity after a gradual start since late 2023. In April alone, it received 21 separate crude cargoes, with all supplies coming from West Africa, mainly Nigerian crude grades, with one cargo from Cameroon; however, it boosted international cargoes in recent months.
The refinery has been broadening the range of crude grades it processes as part of its ambition to operate as a fully merchant refinery. In 2025, about 70 per cent of the refinery’s crude imports came from Nigeria, while 24 per cent originated from the United States.
Dangote plans to double the refinery’s processing capacity to 1.4 million barrels per day by the end of 2028, a level that would enable it to process about 80 per cent of Nigeria’s recent crude oil production in a single day.
