Economy
Is Equity Market Rally Sustainable?
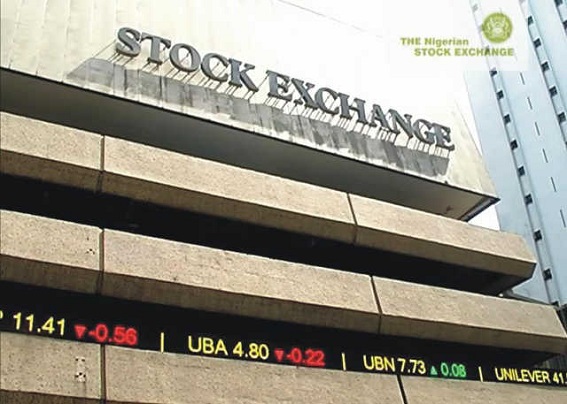
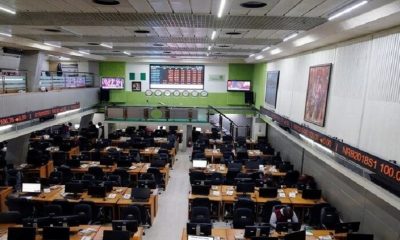
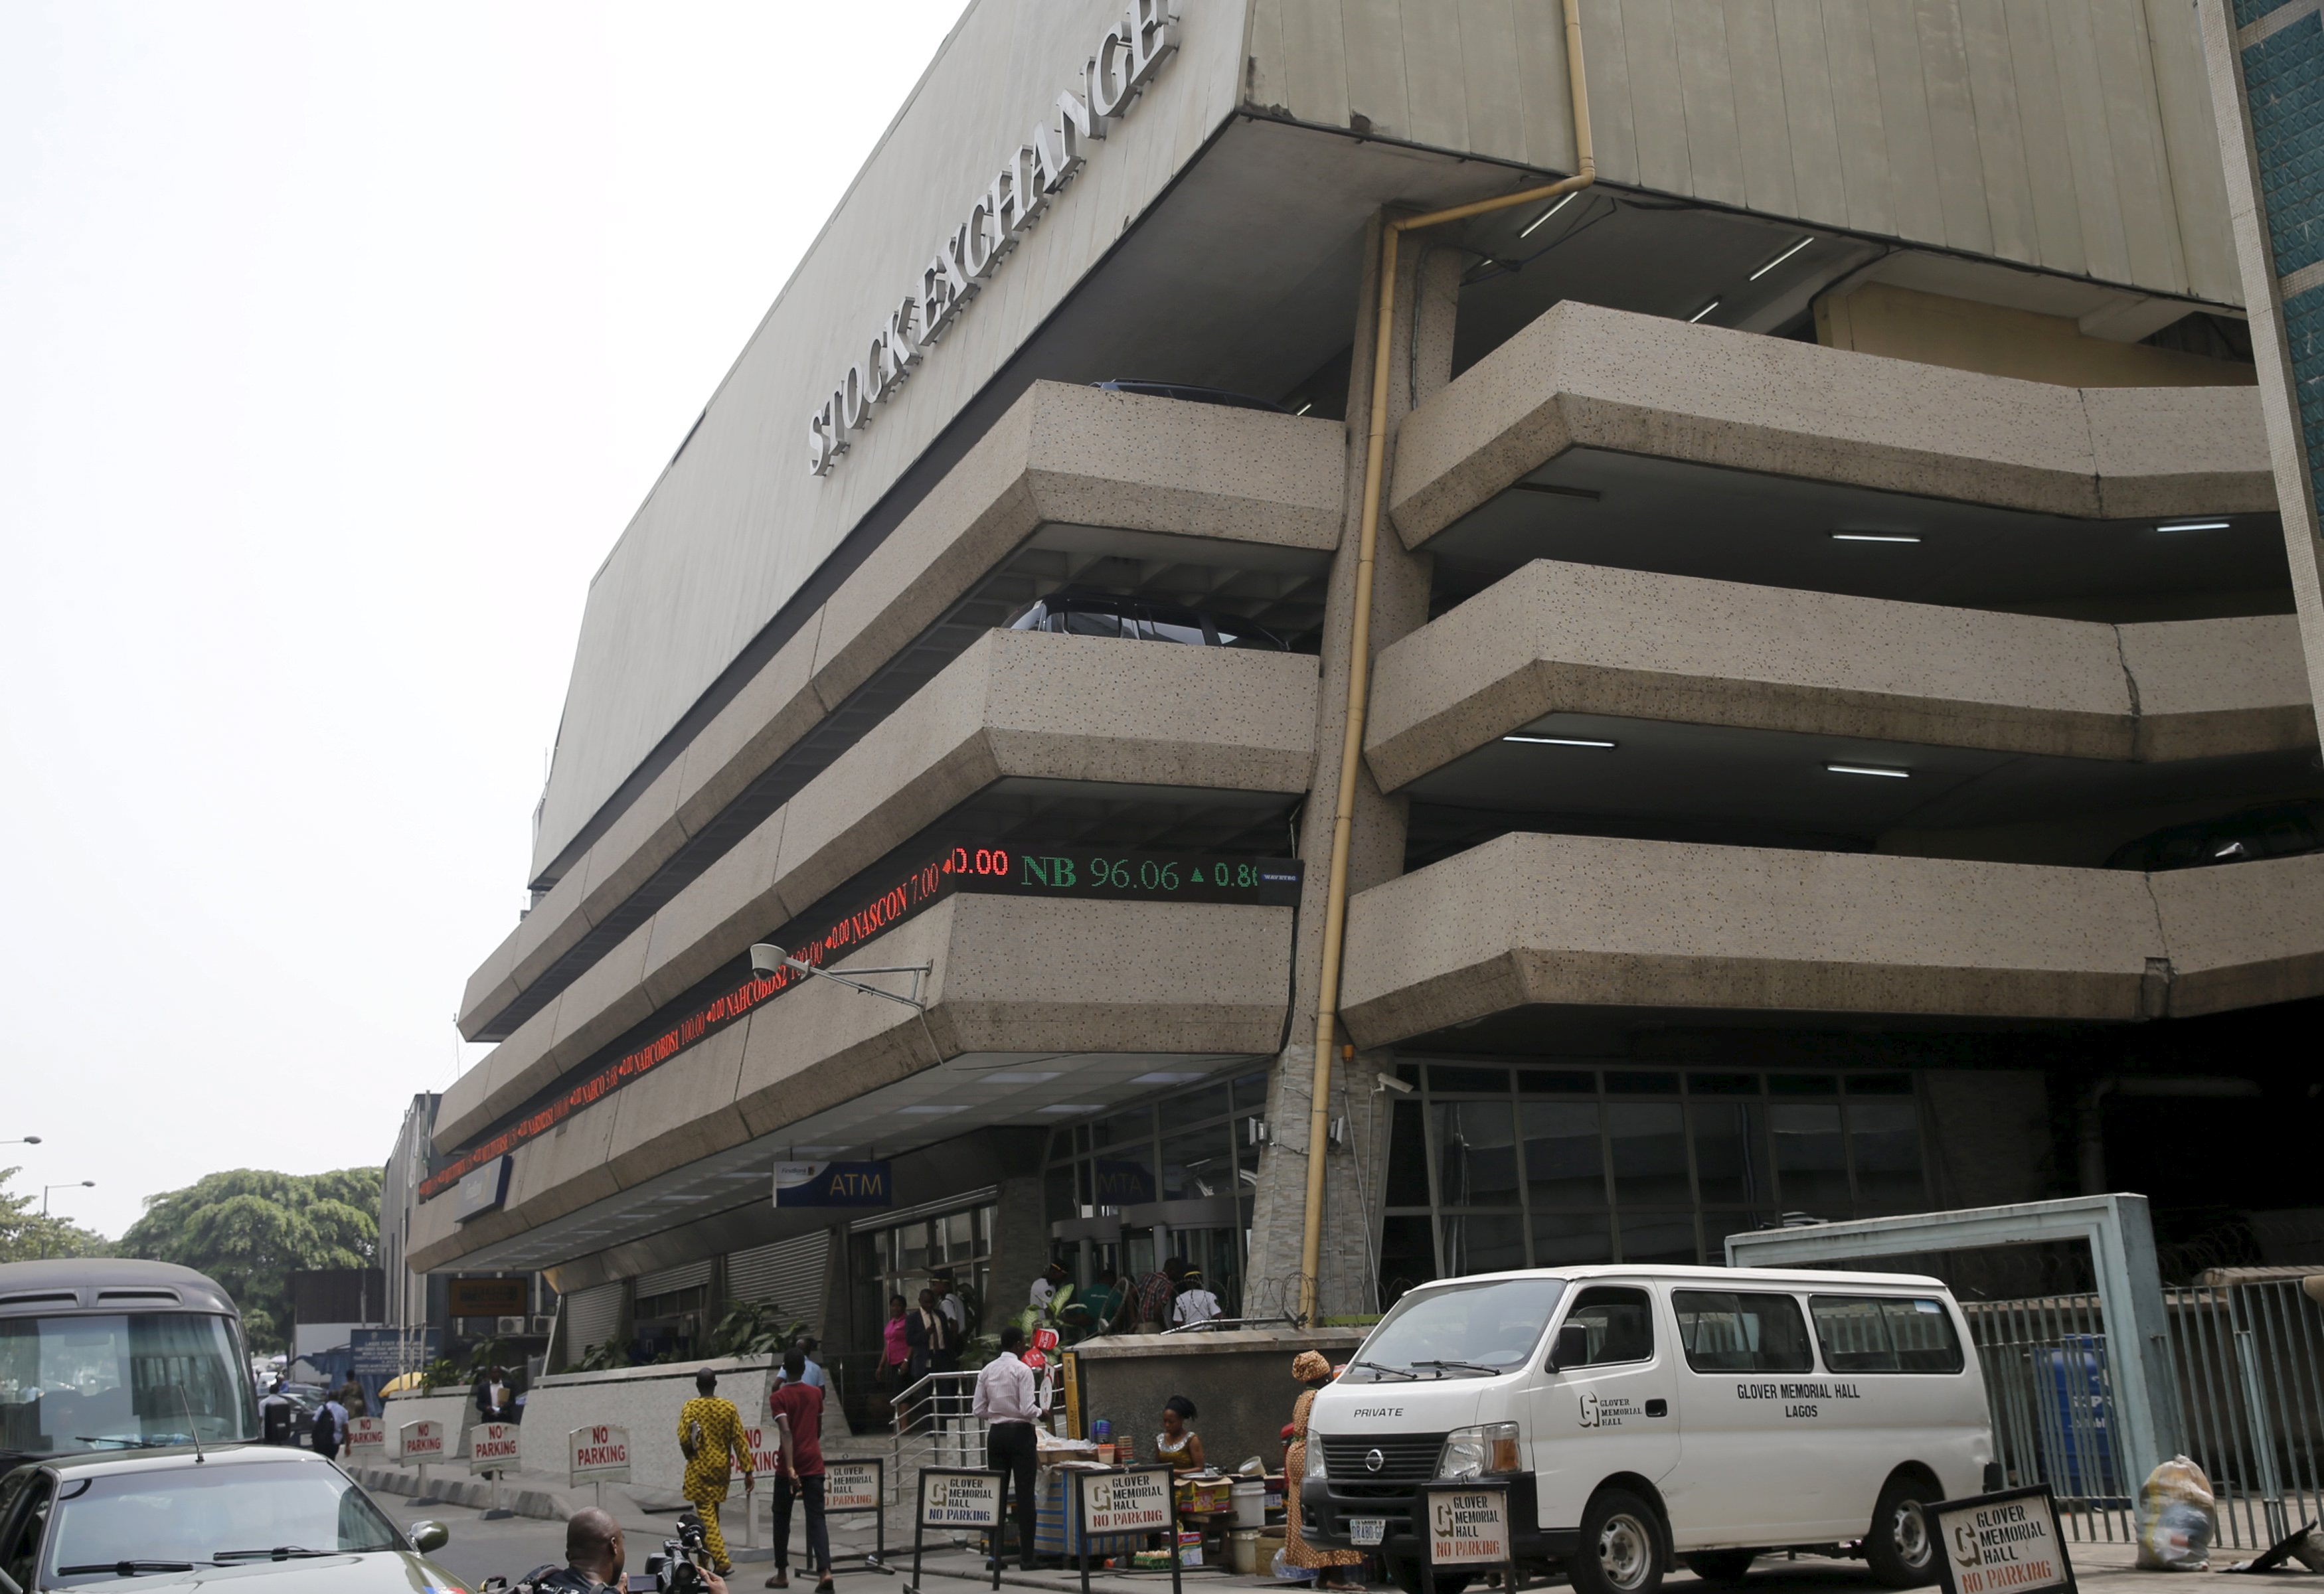
The performance of the Nigerian equity market as measured by The Nigerian Stock Exchange All Share Index (NSE ASI) has been impressive since the beginning of the year 2017.
As at the close of trading on July 27, 2017, the NSE ASI had appreciated by 38.59 percent Year-to-Date (YTD).
A review of the performance of 15 major equity market indices in other countries shows that the NSE ASI recorded the best performance of 37 percent as at July 26, 2017, closely followed by GSE All Share Index (Ghana) at 34 percent.
The International Monetary Fund (IMF) in its World Economic Outlook (WEO) Update July 2017 edition, states that equity prices in advanced economies remain strong, and are showing continued market confidence about company earnings.
It notes that markets are also optimistic about emerging market prospects as reflected in strengthening equity markets and some further compression of interest rate spreads.
It however cautions that oil exporters provide an exception to this pattern, because of the dwindling oil prices since March 2017.
The big question in the minds of investors and equity market analysts is if the strong growth in the equity market since April 2017 is sustainable or if there is a bubble waiting to burst.
Our review of the Price to Earnings (P/E) multiples of the top 10 most capitalised stocks on The Nigerian Stock Exchange (NSE) as at July 27, 2017 shows that the companies traded at higher P/E multiples in July 2017 than in July 2016 and in July 2015.
The average P/E multiple for the companies increased from 11.46x in July 2015 to 12.25x in July 2016 and to 27.06x July 27, 2017.
Nestle recorded the highest P/E multiple of 78.87x in July 2017 and 34.91x in July 2015 while Nigerian Breweries recorded the highest P/E multiple in 2016 at 30.7x.
Although a high P/E multiple may indicate that investors believe in the future earnings growth of the company, the current trend in the market shows that stocks are trading far higher than the historical level and a possible correction may be imminent.
The monthly analysis of the NSE ASI shows that the equity market rally started in April 2017. The equity market appreciated between April and July 27, 2017 by 45 percent while it depreciated by 4.15 percent between December 2016 and April 2017.
The equity market followed similar trend between April and June in 2016 and 2017. The equity market recorded negative performance both in January and February 2017 at 3.12 percent and 2.72 percent respectively, with investors’ outlook that 2017 might be another bad year for equity market investment.
However, the fortune of the market changed in March 2017 with a month on month appreciation of 0.74 percent, April 0.95 percent, May 15 percent, June 12 percent, and 12 percent as at July 27, 2017.
YTD, the top gainers in the equity market as at July 27, 2017 are: May & Baker 245.74 percent; Fidson Healthcare 172.66 percent; Stanbic IBTC Holdings 150.00 percent; UBA 124.44 percent; Beta Glass 99.01 percent; Cement Company of Northern Nigeria 94 percent; Airline Services 91.20 percent; Okomu Oil 85.24 percent; FBN Holdings 78.21 percent; and Presco 77.06 percent.
Some notable factors that are responsible for the market rally are: improved business and consumers’ confidence in the economy, consistent improvement in the Purchasing Managers’ Index (PMI), stability in the foreign exchange market leading to the inflow of foreign investors, particularly with the establishment of the Investors and Exporters’ Foreign Exchange Window and the prospect of improvement in corporate earnings.
While we note that the improvement in the macroeconomic environment in the last few months has sustained the rally in the equity market, we think profit taking is imminent on a few stocks that have recorded strong appreciation in their share prices.
Economy
NGX Market Cap Surpasses N110trn as FY 2025 Earnings Impress Investors
By Dipo Olowookere
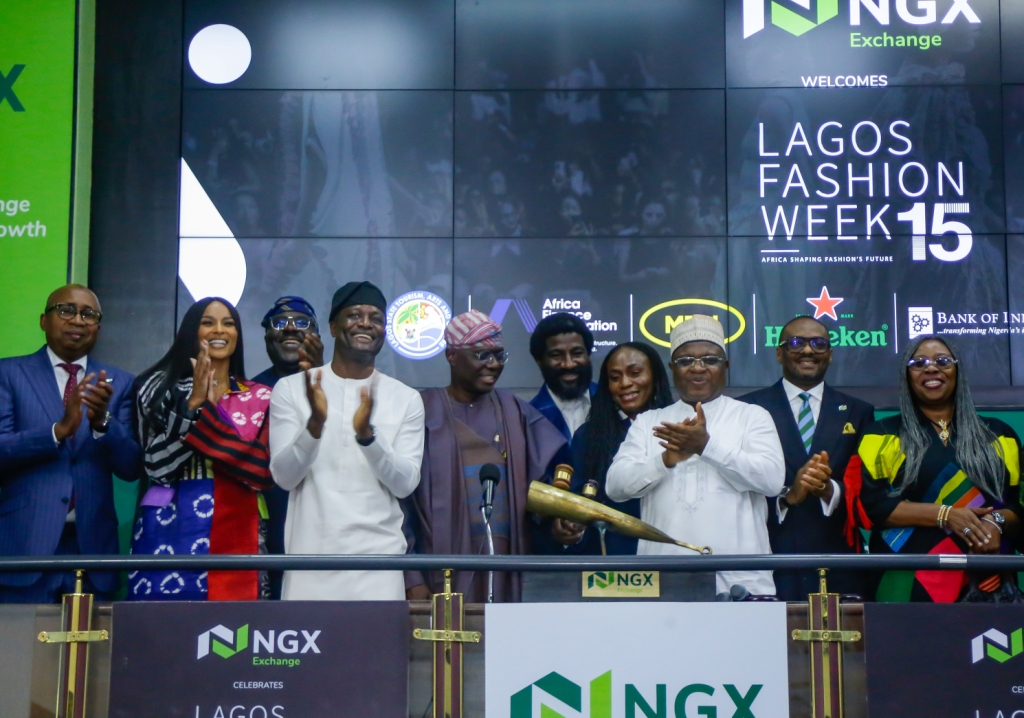
Investors at the Nigerian Exchange (NGX) Limited have continued to show excitement for the full-year earnings of companies on the exchange so far.
On Friday, Customs Street further appreciated by 1.01 per cent as more organization released their financial statements for the 2025 fiscal year.
During the session, traders continued their selective trading strategy, with the energy sector going up by 2.47 per cent at the close of business despite profit-taking in the banking counter, which saw its index down by 0.11 per cent.
Yesterday, the insurance space grew by 2.16 per cent, the industrial goods segment expanded by 1.70 per cent, and the consumer goods industry jumped by 0.42 per cent.
Consequently, the All-Share Index (ASI) increased by 1,722.13 points to 171,727.49 points from 170,005.36 points, and the market capitalisation soared by N1.106 trillion to N110.235 trillion from the N109.129 trillion it ended on Thursday.
Business Post reports that there were 59 appreciating stocks and 19 depreciating stocks on Friday, representing a positive market breadth index and strong investor sentiment.
The trio of Omatek, Deap Capital, and NAHCO gained 10.00 per cent each to sell for N2.64, N6.82, and N136.40 apiece, as Zichis and Austin Laz appreciated by 9.98 per cent each to close at N6.72 and N5.40, respectively.
Conversely, The Initiates depreciated by 9.74 per cent to N19.45, DAAR Communications slumped by 7.32 per cent to N1.90, United Capital crashed by 6.55 per cent to N18.55, Coronation Insurance lost 5.71 per cent to quote at N3.30, and First Holdco shrank by 5.53 per cent to N47.00.
The activity chart showed an improvement in the activity level, with the trading volume, value, and number of deals up by 33.77 per cent, 93.27 per cent, and 10.63 per cent, respectively.
This was because traders transacted 953.8 million shares worth N43.1 billion in 51,005 deals compared with the 713.0 million shares valued at N22.3 billion traded in 46,104 deals a day earlier.
Fidelity Bank was the most active with 92.4 million units sold for N1.8 billion, Chams transacted 69.2 million units valued at N310.9 million, Deap Capital exchanged 59.1 million units worth N382.7 million, Access Holdings traded 57.2 million units valued at N1.3 billion, and Tantalizers transacted 48.6 million units worth N228.2 million.
Economy
Naira Retreats to N1,366.19/$1 After 13 Kobo Loss at Official Market
By Adedapo Adesanya
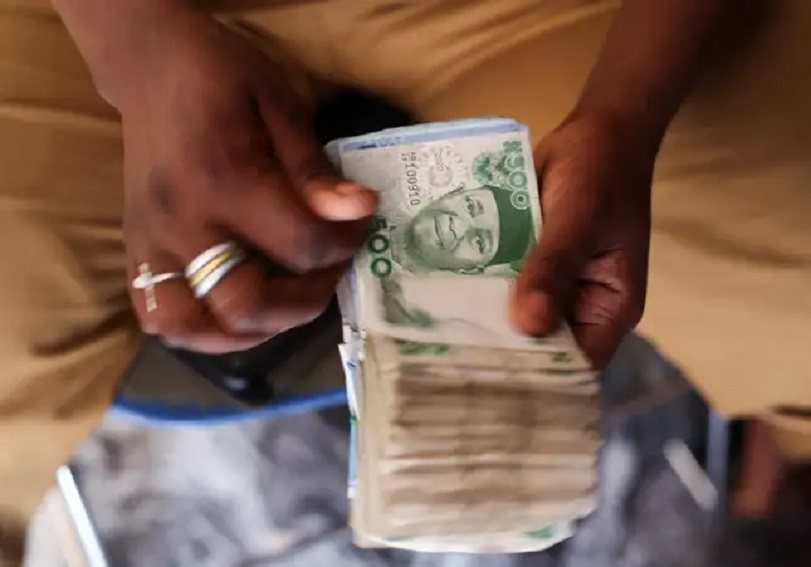
The value of the Naira contracted against the United States Dollar on Friday by 13 Kobo or 0.01 per cent to N1,366.19/$1 in the Nigerian Autonomous Foreign Exchange Market (NAFEX) from the previous day’s value of N1,366.06/$1.
According to data from the Central Bank of Nigeria (CBN), the Nigerian currency also depreciated against the Pound Sterling in the same market window yesterday by N2.37 to N1,857.75/£1 from the N1,855.38/£1 it was traded on Thursday, and further depleted against the Euro by 57 Kobo to close at N1,612.52/€1 versus the preceding session’s N1,611.95/€1.
In the same vein, the exchange rate for international transactions on the GTBank Naira card showed that the Naira lost N8 on the greenback yesterday to N1,383/$1 from the previous day’s N1,375/$1 and at the black market, the Nigerian currency maintained stability against the Dollar at N1,450/$1.
FX analysts anticipate this trend to persist, primarily influenced by increasing external reserves, renewed inflows of foreign portfolio investments, and a reduction in speculative demand.
In the short term, stability in the FX market is expected to continue, supported by policy interventions and improving market confidence.
Nigeria’s foreign reserves experienced an upward trajectory, increasing by $632.38 million within the week to $46.91 billion from $46.27 billion in the previous week.
The Dollar appreciation this week appears to be largely technical, serving as a correction to the substantial losses experienced from mid- to late January.
Meanwhile, the cryptocurrency market slightly appreciated, with Bitcoin (BTC) climbing near $68,000, up nearly 5 per cent since hitting $60,000 late on Thursday after investor confidence in crypto’s utility as a store of value, inflation hedge, and digital currency faltered.
The sell-off extended beyond crypto, with silver plunging 15 per cent and gold sliding more than 2 per cent. US stocks also fell.
The latest recoup saw the price of BTC up by 4.7 per cent to $67,978.96, as Ethereum (ETH) appreciated by 6.3 per cent to $2,021.10, and Ripple (XRP) surged by 9.5 per cent to $1.42.
In addition, Solana (SOL) grew by 7.3 per cent to $85.22, Cardano (ADA) added 6.1 per cent to trade at $0.2683, Dogecoin (DOGE) expanded by 5.4 per cent to $0.0958, Litecoin (LTC) rose by 5.2 per cent to $53.50, and Binance Coin (BNB) jumped by 2.3 per cent to $637.79, while the US Dollar Tether (USDT) and the US Dollar Coin (USDC) traded flat at $1.00 each.
Economy
Oil Prices Climb on Worries of Possible Iran-US Conflict
By Adedapo Adesanya
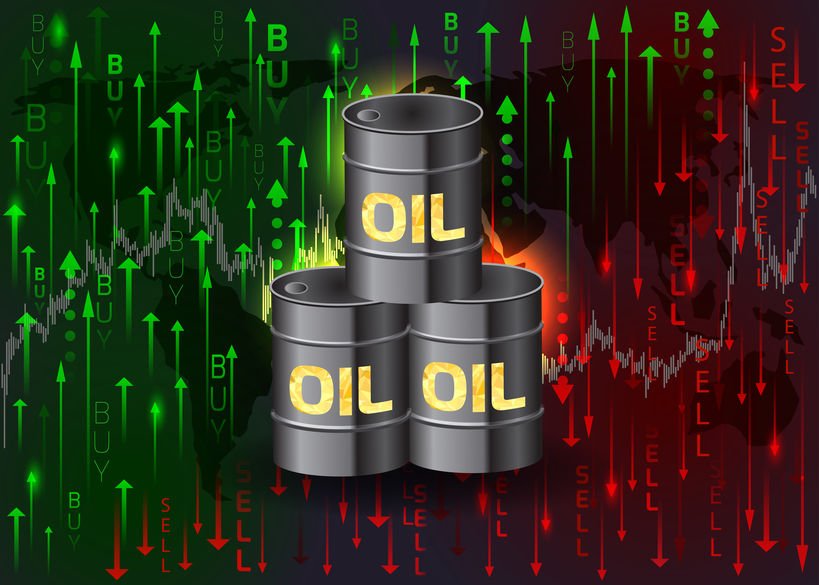
Oil prices settled higher on Friday as traders worried that this week’s talks between the US and Iran had failed to reduce the risk of a military conflict between the two countries.
Brent crude futures traded at $68.05 a barrel after going up by 50 cents or 0.74 per cent, and the US West Texas Intermediate (WTI) crude futures finished at $63.55 a barrel due to the addition of 26 cents or 0.41 per cent.
Iran and the US held negotiations in Muscat, the capital of Oman, on Friday to overcome sharp differences over Iran’s nuclear programme.
It was reported that the talks had ended with Iran’s foreign minister saying negotiators will return to their capitals for consultations and the talks will continue.
Regardless, the meeting kept investors anxious about geopolitical risk, as Iran wanted to stick to nuclear issues while the US wanted to discuss Iran’s ballistic missiles and support for armed groups in the region.
Any escalation of tension between the two nations could disrupt oil flows, since about a fifth of the world’s total consumption passes through the Strait of Hormuz between Oman and Iran.
Saudi Arabia, the United Arab Emirates, Kuwait and Iraq export most of their crude via the strait, as does Iran, which is a member of the Organisation of the Petroleum Exporting Countries (OPEC).
According to Reuters, Iran objected to the presence of any US Central Command (CENTCOM) or other regional military officials, saying that would jeopardise the process.
The current confrontation was sparked by more than two weeks of unrest in Iran that saw authorities launch a deadly crackdown that killed thousands of civilians and shocked the world. As reports of the deaths trickled out of Iran, US President Donald Trump threatened to strike Iran if any of the tens of thousands of protesters arrested were executed.
Meanwhile, Kazakhstan’s planned oil exports could fall by as much as 35 per cent this month via its main route through Russia, as the country’s top oil company, Tengiz oilfield, slowly recovers from fires at power facilities in January.
ING analysts have pointed out Iran’s neighbour, Iraq, and a disagreement with the US as another bullish factor for oil prices. It seems Iraqi politicians favour Mr Nouri al-Maliki as the country’s next Prime Minister, but the US thinks Mr al-Maliki is too close to Iran. President Trump has already threatened the oil producer with consequences if he emerges as PM.
-

 Feature/OPED6 years ago
Davos was Different this year
-
Travel/Tourism9 years ago
Lagos Seals Western Lodge Hotel In Ikorodu
-

 Showbiz3 years ago
Estranged Lover Releases Videos of Empress Njamah Bathing
-
 Banking8 years ago
Sort Codes of GTBank Branches in Nigeria
-

 Economy3 years ago
Subsidy Removal: CNG at N130 Per Litre Cheaper Than Petrol—IPMAN
-
 Banking3 years ago
Sort Codes of UBA Branches in Nigeria
-

 Banking3 years ago
First Bank Announces Planned Downtime
-

 Sports3 years ago
Highest Paid Nigerian Footballer – How Much Do Nigerian Footballers Earn


