
Economy
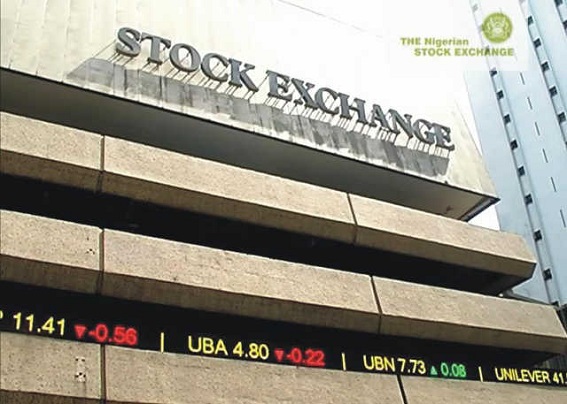
Equity Market Ready for Recovery
By FSDH Research
There are indications that the Nigerian equity market is ready for a recovery in the year 2017 after three consecutive years of decline. The equity market, as measured by The Nigerian Stock Exchange All Share Index (NSEASI), depreciated by 16.14%, 17.36% and 6.17% in 2014, 2015 and 2016 respectively.
As at April 28, 2017 the NSEASI had lost 4.15% of its value. The major factors responsible for the poor performance of the equity market in the last three years are: weak macroeconomic performance, inconsistent policies, weak corporate earnings and portfolio realignment from equities to fixed income securities.
However, looking at the strong growth in the unaudited results that quoted companies released for the period January – March 2017 and the improvement in the macroeconomic environment, we believe the equity market is ready for a recovery in 2017.
As at April 27, 2017, 62 quoted companies had released their unaudited quarterly results for the period January – March 2017.
The total turnover of these companies increased by 41% from N1,450billion in 2016 to N2,042bilion in 2017.
The Profit Before Tax (PBT) increased by 45% from N257billion in 2016 to N373billion in 2017 while the Profit After Tax increased by 29% from N240billion in 2016 to N310billion in2017.
The recent increase in the crude oil price and production and subsequent increase in the external reserves have helped to stabilise the foreign exchange market – a major concern of the foreign investors. The increase in the supply of foreign exchange to meet the input requirements of manufacturing companies should increase their production activities and revenue in the current financial year.
The fiscal and the monetary authorities are implementing policies that should inspire investors’ confidence in the Nigerian economy and market.
Our survey shows that most investors did a lot of portfolio realignment -moving from equities to fixed income securities. The main reason for this was the lacklustre performance of equities in the face of attractive yields on fixed income securities.
The data from the National Pension Commission (PenCom) on the allocation of the Pension Fund Assets as at February 2017 shows that the weight of the pension fund assets on domestic equity dropped consistently from 2014 to 2017.
The weight stood at 13.7%, 10.4%, 8.6% and 7.5% in February 2014, 2015, 2016 and 2017 respectively. These figures are lower than PenCom’s approved pension fund assets allocation weight to equities, an indication that there is room for pension fund assets to allocate more funds to equities.
PenCom stipulates the maximum weights of equities in the investment portfolio of pension assets as follows: Fund I: 30%; Fund II: 25%, Fund III: 10% and Fund IV: 5%. Any pension contributor can make a formal request to join Fund I. Fund II is for active contributors who are below the age of 49 years. Fund III is for active contributors who are 50 years and above while Fund IV is strictly for retirees.
The analysis of the equity transactions on the NSE in the last three years shows investors’ apathy for equity investment.
According to the NSE, the value of equity transactions from foreign and domestic investors declined between 2014 and 2016.
Foreign transactions were N1.54trillion, N1.03trillion and N0.52trillion in 2014, 2015 and 2016 respectively while Domestic transactions were N1.14trillion, N0.88trillion and N0.63trillion in 2014, 2015 and 2016 respectively.
Although the relative size of foreign investors’ participation in the equity market declined between 2014 and 2016 (58%, 54% and 45% in 2014, 2015 and 2016 respectively), the share of foreign investors’ participation was higher than domestic investors’ participation between 2014 (Foreign: 58% and Domestic: 42%) and 2015 (Foreign: 54% and Domestic: 46%).
The foreign investors’ participation in 2016 at 46% was lower than domestic investors’ participation at 54%.
The uncertainties surrounding the foreign exchange policies and the difficulties to access foreign exchange to repatriate capital and profit led to the withdrawal of foreign investors from the market. The stability in the macroeconomic environment and the strong earnings of quoted companies should attract the needed liquidity into the market. Consequently, the equity market should record a strong recovery in the year 2017.
Source: FSDH Research

By Adedapo Adesanya
The National Pension Commission (PenCom) has defended its decision to allow Pension Fund Administrators (PFAs) to invest in the parent companies of their custodians, insisting that adequate safeguards are in place to protect contributors’ funds.
The director-general of the pension regulator, Ms Omolola Oloworaran, speaking on Tuesday during the Meet the Press Briefing at the Presidential Villa, Abuja, said the commission’s decision to relax the investment restriction followed a comprehensive risk assessment that found minimal conflict of interest.
She explained that under PenCom’s investment regulations, PFAs are only permitted to invest pension assets in carefully selected instruments that meet stringent criteria, including profitability, strong credit ratings and proven track records.
According to her, the commission regularly reviews its investment regulations, conducts routine examinations and spot checks on PFAs to ensure strict compliance with established risk management guidelines.
“PFAs cannot just go into the stock market and buy any kind of stock. There are strict guidelines. Companies must demonstrate profitability, have a proven track record and satisfy other criteria before pension funds can invest,” she said.
Ms Oloworaran noted that each PFA also operates under the oversight of a board, an investment committee and a risk management committee, providing additional layers of governance to safeguard contributors’ funds.
She said PenCom recently issued a circular allowing PFAs to invest in the parent companies of their custodians after determining that the potential conflict of interest was negligible.
The PenCom boss explained that the parent companies involved are largely Tier-1 banks, including First Bank, United Bank for Africa (UBA) and Zenith Bank, which she described as A-rated institutions with strong financial foundations.
She said the policy was intended to widen investment opportunities for pension funds without compromising safety.
Using Stanbic IBTC as an example, Ms Oloworaran explained that if its custodian is Zenith Bank, the previous restriction prevented the pension administrator from investing in Zenith Bank shares despite the bank’s strong performance.
“We reviewed the risks and any potential conflict of interest and found the risks to be very low. That is why we opened that investment window,” she said.
By Aduragbemi Omiyale
Analysts at Meristem Research have predicted that the inflation rate for June 2026 in Nigeria should marginally rise to 15.95 per cent on a year-on-year basis from the 15.93 per cent reported in May 2026.
The National Bureau of Statistics (NBS) is expected to release inflation numbers for last month later today, Wednesday, July 15, 2026.
In its report sighted by Business Post, Meristem Research said it expects inflationary pressures to re-emerge across key economies in the near term, as the re-escalation of the US-Iran conflict has reignited upward pressure on global oil prices.
It disclosed that this marks a sharp reversal from most of June, when the ceasefire between the two countries helped drive oil prices lower, raising expectations of some relief on the inflation front.
With conflicts now flaring up again, oil prices are likely to increase again, and the anticipated easing in energy-driven inflation may not materialise as broadly as earlier envisaged.
“Nonetheless, some relief is likely from the food segment, where robust supply conditions across major producing regions and softening demand should continue to ease food price pressures,” it stated.
The team also explained that it projected a 15.95 per cent inflation rate because of the lingering effects of persistent food price pressures.
“However, we expect core inflation to moderate as the sharp reversal in energy prices begins to filter through to transportation, distribution, and other energy-related costs, easing underlying price pressures.
“On a month-on-month basis, the combined effect of lower petrol prices, a relatively stable Naira, and the gradual pass-through of reduced energy costs across the supply chain should exert further downward pressure on inflation.
“Based on our assessment, food inflation is expected to remain the key swing factor, as seasonal pre-harvest supply constraints are likely to offset some of the gains from lower logistics costs,” it said.

By Adedapo Adesanya
The duo of Central Securities Clearing System (CSCS) Plc and Afriland Properties Plc weakened the NASD Over-the-Counter (OTC) Securities Exchange by 1.61 per cent on Tuesday, July 14.
CSCS Plc saw its stock value drop N9.08 to close at N82.40 per share compared with the preceding session’s N91.48 per share, and Afriland Properties Plc slid by 17 Kobo to sell at N15.00 per unit versus N15.70 per unit.
The losses recorded by the two securities pulled back the market capitalisation by N41.64 billion to N2.546 trillion from N2.587 trillion, and cracked the NASD Security Index (NSI) by 69.36 points to 4,242.31 points from 4,311.67 points.
It was observed that the exchange witnessed two price advancers during the session, led by FrieslandCampina Wamco Nigeria Plc, which gained N1.37 to end at N151.37 per share compared with the previous day’s N150.00 per share, and Food Concepts Plc chalked up 5 Kobo to settle at N2.50 per unit versus N2.45 per unit.
The volume of securities traded by market participants surged by 50.7 per cent to 13.7 million units from the previous 9.1 million units, while the value of securities went down by 79.7 per cent to N65.2 million from N320.4 million, and the number of deals crashed by 3.6 per cent to 27 deals from the previous session’s 28 deals.
At the close of transactions, Great Nigeria Insurance (GNI) Plc remained the most traded stock by value on a year-to-date basis, with the sale of 3.4 billion units for N8.4 billion, trailed by Infrastructure Credit Guarantee (Infracredit) Plc, which exchanged 2.3 billion units valued at N6.5 billion, and CSCS Plc with 73.9 million units transacted for N5.2 billion.
GNI Plc also closed the trading day as the most traded stock by volume on a year-to-date basis, with 3.4 billion units worth N8.4 billion, followed by Infracredit Plc with 2.3 billion units traded for N6.5 billion, and Resourcery Plc with 1.1 billion units valued at N415.7 million.
