
Economy
Escalating Trade Dispute May Lead to Pullback on Wall Street
By Investors Hub
The major U.S. index futures are currently pointing to a lower opening on Friday, with stocks likely to move back to the downside following the attempted recovery from an early sell-off in the previous session.
Concerns about the economic impact of an escalating trade dispute between the U.S. and China may weigh on the markets after the U.S. raised tariffs on Chinese imports.
The U.S. hiked the tariff on $250 billion worth of Chinese goods from 10 percent to 25 percent after the U.S. and China failed to reach a trade deal by a midnight deadline.
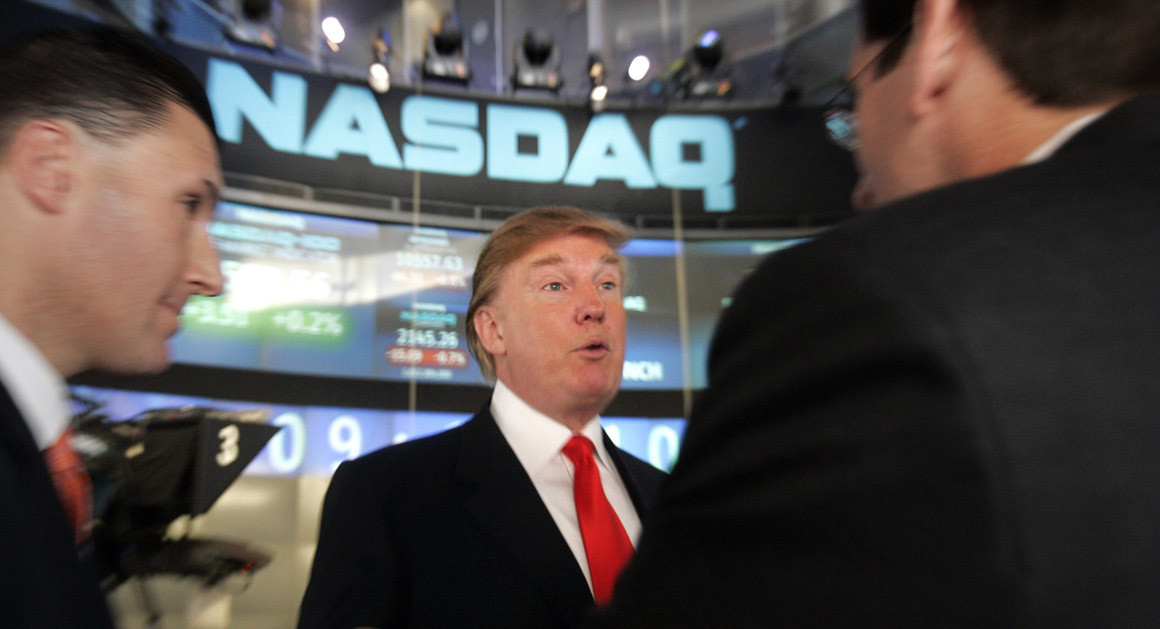
President Donald Trump noted in a post on Twitter that the process has begun to place tariffs on the remaining $325 billion worth of Chinese imports.
Trump praised the massive tariff payments to the U.S. Treasury and said there is ?absolutely no rush? to reach a trade agreement with China.
?Tariffs will bring in FAR MORE wealth to our Country than even a phenomenal deal of the traditional kind. Also, much easier & quicker to do,? Trump tweeted.
?Tariffs will make our Country MUCH STRONGER, not weaker. Just sit back and watch!? he added. ?In the meantime, China should not renegotiate deals with the U.S. at the last minute. This is not the Obama Administration, or the Administration of Sleepy Joe, who let China get away with ?murder!??
After falling sharply early in the session, stocks regained ground over the course of the trading day on Thursday but still closed mostly lower. Reaction to comments from Trump was the main driver of trading on the day.
The major averages finished the session in negative territory but well off their worst levels of the day. The Dow slid 138.97 points or 0.5 percent to 25,828.36, the Nasdaq fell 32.73 points or 0.4 percent to 7,910.59 and the S&P 500 slipped 8.70 points or 0.3 percent to 2,870.72.
The initial sell-off on Wall Street came amid renewed trade concerns following tough talk from Trump ahead of two days of U.S.-China trade talks in Washington.
Trump claimed during a rally in Florida on Wednesday that the U.S. is planning to raise tariffs on Chinese goods because China “broke the deal.”
“So they’re flying in, the vice premier tomorrow is flying in ? good man ? but they broke the deal,” Trump told his supporters. “They can’t do that, so they’ll be paying.”
However, stocks staged a recovery attempt after Trump told reporters at the White House a trade deal with China is still possible.
Trump indicated he has set a midnight deadline to reach a trade agreement, calling raising tariffs an “excellent” alternative.
Analysts have previously urged investors to focus on Trump’s actions rather than his words, suggesting the president’s bluster is merely a negotiating tactic.
On the U.S. economic front, the Commerce Department released a report showing the U.S. trade deficit widened in the month of March.
The report said the trade deficit widened to $50.0 billion in March from a revised $49.3 billion in February. Economists had expected the deficit to widen to $50.2 billion.
The wider trade deficit came as the value of imports surged up by 1.1 percent to $262.0 billion compared to a 1.0 percent jump in the value of exports to $212.0 billion.
The Labor Department also released a report showing producer prices increased in line with economist estimates in the month of April.
The report said producer price index for final demand rose by 0.2 percent in April after climbing by 0.6 percent in March. The uptick in prices matched expectations.
Excluding food and energy prices, core producer prices inched up by 0.1 percent in April after rising by 0.3 percent in March. Economists had expected core prices to edge up by 0.2 percent.
A separate Labor Department report showed first-time claims for U.S. unemployment benefits pulled back by less than expected in the week ended May 4th.
The Labor Department said initial jobless claims dipped to 228,000, a decrease of 2,000 from the previous week’s unrevised level of 230,000. Economists had expected jobless claims to drop to 220,000.
Despite the recovery attempt by the broader markets, significant weakness remained visible among networking stocks.
The NYSE Arca Networking Index regained ground after hitting its worst intraday level in well over a month but still ended the day down by 2.2 percent.
Considerable weakness also remained visible among semiconductor stocks, as reflected by the 1.2 percent loss posted by the Philadelphia Semiconductor Index.
Intel (INTC) plunged by 5.3 percent after BMO Capital downgraded its rating on the semiconductor giant to Market Perform from Outperform.
Gold, chemical, and computer hardware stocks also ended the day notably lower, while most of the other major sectors showed more modest moves.
By Adedapo Adesanya
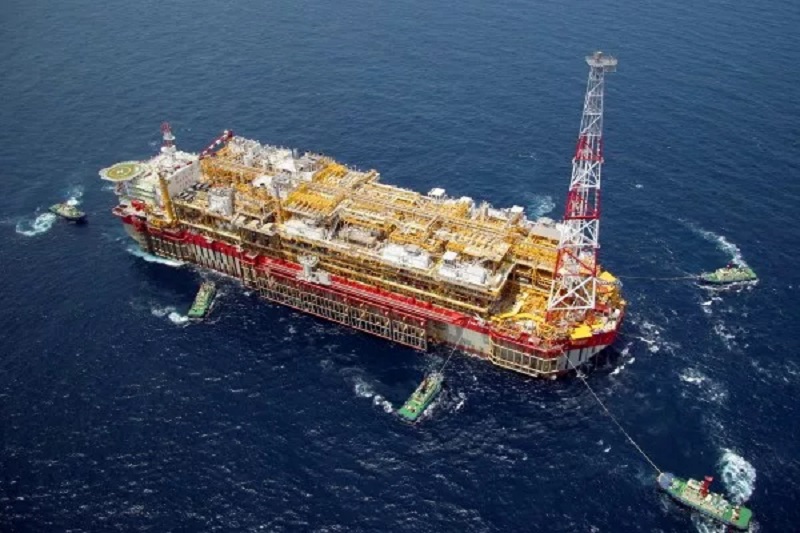
About 143 companies that successfully passed the technical and prequalification stages of the Nigerian Upstream Petroleum Regulatory Commission’s (NUPRC) 2025 Licensing Round will, today, compete for 50 oil and gas blocks at the commercial bid conference in Abuja, the final stage in the allocation process for the assets.
The commission said only the prequalified companies have been invited to attend the event, which will hold at the Conference Centre of the Transcorp Hilton Hotel, Abuja, stressing that participation is strictly by invitation.
The commercial bid conference will determine the successful bidders for oil and gas assets located across Nigeria’s producing and frontier basins.
The 50 blocks comprise 16 onshore blocks and 18 shallow water blocks in the Niger Delta, one deep offshore block, three onshore blocks in the Benin Basin, four in the Anambra Basin, four in the Chad Basin, and four in the Benue Trough.
According to the commission, the winning bids will be determined through a transparent evaluation process based on clearly defined commercial parameters. These include the signature bonus offered by bidders, the proposed work programme commitment and the level of performance security provided. The final selection will be based on a weighted technical and commercial score.
The licensing round is being conducted under the provisions of the Petroleum Industry Act (PIA) 2021, which requires a transparent and competitive process for the award of petroleum assets.
NUPRC had announced the commencement of the 2025 Licensing Round on November 11, 2025, before opening the online bid portal on December 1, 2025, to enable interested companies to register and participate in the exercise.
To ensure prospective investors fully understood the requirements, the commission organised a pre-bid conference on January 14, 2026, at Eko Hotels and Suites, Lagos. The event provided detailed explanations on the licensing guidelines and bidding procedures to registered participants and other stakeholders.
Registration and submission of prequalification documents closed on February 27, 2026, while the prequalification evaluation was completed on March 16, 2026.
NUPRC disclosed that 286 companies initially submitted applications for prequalification.
Following the evaluation process, 196 companies were cleared to participate in the technical and commercial bid stages.
The prequalified 143 companies eventually submitted a total of 200 bids for the available oil and gas blocks. These companies are now set to compete at the commercial bid conference, where the financial offers will be opened and evaluated to determine the eventual winners.
The licensing round is expected to attract fresh investment into Nigeria’s upstream petroleum sector, boost exploration activities across both producing and frontier basins, increase crude oil and gas reserves, and support the country’s drive to grow production and government revenue.
It also underscores the regulator’s commitment to implementing a transparent, competitive and investor-friendly licensing regime under the Petroleum Industry Act.

By Adedapo Adesanya
The Monetary Policy Committee (MPC) of the Central Bank of Nigeria (CBN) has retained all key monetary policy parameters following the conclusion of its two-day meeting on July 21, 2026, on Tuesday, maintaining its tight monetary policy stance to curb inflation and support macroeconomic stability.
According to the Governor of the apex bank, Mr Yemi Cardoso, who chaired the committee, the Monetary Policy Rate (MPR), which serves as the benchmark interest rate, remains at 26.50 per cent. The MPC also retained the asymmetric corridor around the MPR at +50 basis points and -450 basis points.
In addition, the Cash Reserve Ratio (CRR) for commercial banks was left unchanged at 45.00 per cent, while the CRR for merchant banks remains at 16.00 per cent. The committee also retained the CRR on non-Treasury Single Account (Non-TSA) public sector deposits at 75.00 per cent, with the liquidity ratio at 30.00 per cent.
The decision reflects the apex bank’s continued commitment to containing inflationary pressures through a restrictive monetary policy while safeguarding the resilience of Nigeria’s financial system amid ongoing macroeconomic adjustments.
By keeping all policy tools unchanged, the MPC signalled its intention to continue managing excess liquidity in the banking sector and maintain stability in financial markets.
The move is also expected to provide greater policy certainty for investors and businesses monitoring the country’s monetary policy direction.
The latest decision also means borrowing costs are likely to remain elevated in the near term as the central bank continues to prioritise price stability over monetary easing.
Analysts had expected the CBN committee to retain the rate after Nigeria’s headline inflation came in at 15.91 per cent as of June 2026, marking a slight decline from 15.93 per cent in May.
However, even as overall price growth has moderated significantly compared to previous periods, food inflation remains a persistent challenge, accelerating to 17.52 per cent in June.
By Aduragbemi Omiyale
Shareholders of Unilever Nigeria Plc will receive an interim dividend of N2 per share, the board of the organisation has said.
The cash reward was announced after the company released its financial statements for the first half of the year ended June 30, 2026.
The payment will be made on Friday, August 14, 2026, only to investors whose names appear on the Register of Members at the close of business on Friday, July 31, 2026.
A quick look at the financial performance of the firm in the first six months of this year showed that revenue improved by 22.22 per cent to N119.9 billion from the N98.1 billion achieved in the corresponding period of last year.
A rise in earnings also resulted in a 16.43 per cent surge in cost of sales, though this did not shrink the gross profit, which rose by 29.93 per cent to N54.7 billion from N42.1 billion. The operating profit stood at N24.4 billion in the period under review, higher than N18.8 billion in the same period of 2025, while the net finance income contracted by 9.43 per cent to N4.8 billion from N5.3 billion due to elevated borrowing costs.
Business Post reports that despite higher taxes paid in the first six months of 2026, the net profit grew by 8.33 per cent to N15.6 billion from N14.4 billion, enabling the board to pass on value to shareholders for their faith in the firm.
