
Economy
Market Cap of Top 40 Miners Hit $714b—Report

By Dipo Olowookere
A new report by PwC has revealed that market capitalisation of the top 40 mining companies in the world increased by 45 percent to $714 billion, approaching the 2014 level. This was mainly due to rising commodity prices.
The report, titled PwC Mine 2017 report, noted that the world’s Top 40 miners recovered from a race to the bottom, with bolstered balance sheets and a return to profitability in 2016, giving them much-needed space to pause and draw breath.
As it looks to the future, the 14th edition of PwC’s industry series analysing financial performance and global trends, also outlines the new opportunities and hazards on the horizon – and the impact of intransigent or innovative activity.
Mine 2017 was released by PwC Africa last week at the Junior Indaba conference held in Johannesburg.
Michal Kotzé, Energy, Utilities and Mining Industry Leader for PwC Africa, commented: “The narrative of the Top 40 in 2016 tends to read like a mine site safety mantra: Stop. Think … Act. The industry has moved out of danger but 2016 was not a year of significant action, and we now wait to see who will be bold and step out beyond the fluctuating market confidence.”
The report analysed 40 of the largest listed mining companies by market capitalisation. The financial information for 2016 covers the reporting periods 1 April 2015 to 31 December 2016, with each company’s results included for the 12-month financial reporting period that falls into this time frame.
The number of emerging companies included in the Top 40 has decreased by two and now totals 17. There were seven new entrants from the previous year, five of which had made appearances on previous rankings in either 2014 or 2015. First Quantum and Teck Resources re-emerged on the 2016 list after strengthening their financial positions.
The report recognises a return to profitability in 2016, with an aggregate Top-40 net profit of $20 billion; after an aggregate loss of $28 billion in 2015. The improved fortunes of the industry were then directed to strengthening balance sheets.
Revenue from the Top 40 remained relatively flat – up just one percent from the previous year’s sum of $491 billion – despite a rebound in commodity prices, particularly coal and iron ore in the second half of the year.
Capex fell dramatically again, by a further 41 percent, to a new record low of just $50 billion, the report noted.
After hitting a near-record in 2015, impairment charges tumbled last year to a less-alarming $19 billion.
The report said debt repayments totalled $93 billion, up from $73 billion a year earlier, with most of the debt issued to refinance, rather than fund acquisitions or mine development.
Kotzé added: “We see an improved gearing ratio of 41 per cent, down from the 2015 record of 49 per cent. But this is still well above the 10 year average of 29 per cent. Interestingly, we also found that around half the capex figure was invested in sustaining activities, so the growth capital portion was strikingly small compared with previous years.”
Rapidly rising commodity prices sparked renewed market optimism and improved credit ratings across the Top 40 firms. Valuations also climbed, especially for the traditional miners, with the trend continuing through the first quarter of 2017 even as commodity prices remained flat. But, valuations aside, there is little to suggest that the group made any substantial advances throughout the year.
For the fourth consecutive year, the industry reduced spending on exploration. $7.2 billion was invested in 2016, barely one-third of the record $21.5 billion allocated in 2012, with the funds cautiously targeted at less risky, later stage assets, typically located in politically stable countries.
Limited M&A activity
One of the biggest M&A stories of 2016 concerned the assets that did not sell. Numerous large deals, expected to be completed by early 2017, were withdrawn from the market, possibly due to the rebound in commodity prices and the improving prospects of the companies that owned them. More broadly, asset sales in 2016 were largely strategic rather than fire sales. Mines, especially diversified players, sold minority stakes in non-mining businesses.
China in the driving seat
China remains the exception to the dominant investment behaviour within the Top 40. During the downturn, Chinese companies demonstrated one enormous advantage over other miners from both traditional and emerging countries: access to capital.
With deeper pockets, Chinese players were able to fund more acquisitions than their counterparts, either confidently buying assets at bullish prices or moving quickly on assets made available at the bottom of the price cycle. We also saw an increase in acquisitions by Chinese private equity firms, and we expect China to continue to be active in acquiring global mining assets as a way to reduce its longer term dependency on imports.
Moving into action
Balance sheet clean-ups require discipline, and this has resulted in a tailing-off of impairments, the avoidance of any new bankruptcies, the absence of any significant streaming transactions and a general passing of distress. The market rightly applauded this, reinstating a positive gap between market caps and net book values that was absent in 2015.
All of this provides a platform for decisive action in the future. While many will be willing to ride the waves of industry sentiment, others will see the conditions as ripe for value accretive moves, with market differentiation their immediate goal.
Action might also come in the form of commitments to greenfield projects, M&A or technology – or a combination of these – while others may realign their strategy in response to external forces such as recycling and substation, shareholder activism and government intervention.
Will the digital revolution become an enduring part of the mining psyche?
New technologies promising a boost for the sector include software to optimise asset utilisation, devices to remotely monitor and control activities, and robotics to automate repetitive task.
The benefits of asset optimisation tools are significant. According to an analysis by PwC, it is estimated that maintenance costs can be reduced by 20 to 40 percent, asset utilisation increased by up to 20 percent, capital expenses reduced by 5 to 10 percent, while also delivering improved environmental, health and safety outcomes. A number of Top 40 miners have announced or implemented digital innovations that are already enhancing performance.
Andries Rossouw, PwC Assurance Partner commented: “Mining companies need to combine engineering excellence and know-how with a new open-mindedness to learn from advanced analytics and a need to embrace robotics and platforms that fundamentally challenge decades of doing things the same way…it is as much about behaviour as technology.”
Rossouw concludes: “The key question is, who will act rather than simply react? There will be more advances this year but how impactful they will be, remains to be seen.”
By Adedapo Adesanya
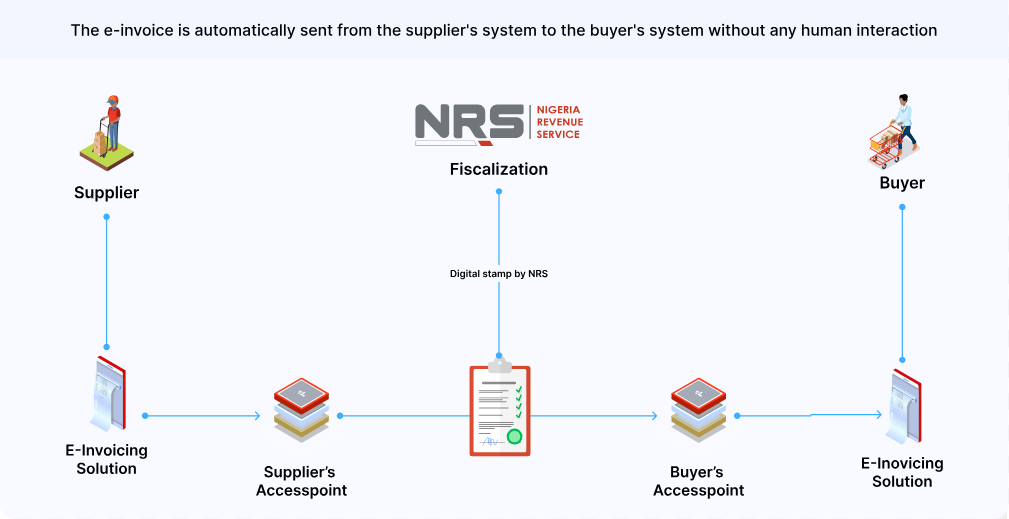
The Nigeria Revenue Service (NRS) says the rollout of electronic invoicing (e-invoicing) will strengthen tax compliance, curb revenue leakages and improve transparency in tax administration as it moves to fully digitise the country’s tax system.
The Project Lead for the NRS e-Invoicing Project, Mr Mohammed Bawa, stated this at the DigiTax E-Invoicing Compliance Breakfast Session held in Lagos on Wednesday.
The event, organised by DigiTax, an NRS-accredited e-invoicing platform, formed part of efforts to support the agency’s ongoing education and sensitisation campaign on the e-invoicing mandate.
Mr Bawa said the initiative aligns with global trends in tax digitisation and is expected to help improve Nigeria’s tax-to-GDP ratio, which remains one of the lowest in Africa.
According to him, the system will provide the NRS with greater visibility into transactions across sectors, formalise activities within the informal economy and standardise invoice formats nationwide using globally recognised invoice schemas.
He added that e-invoicing would improve operational efficiency for both businesses and tax authorities while supporting the NRS’ transition from manual and electronic tax administration processes to a fully automated system-to-system interaction model.
Mr Bawa noted that the legal framework for implementation is backed by the Nigeria Tax Administration Act, which prescribes penalties for non-compliance.
He disclosed that the NRS has completed onboarding large taxpayers and is preparing to enforce compliance with defaulting entities.
According to him, medium taxpayers are expected to begin compliance in the third quarter of 2026, while onboarding of emerging taxpayers will commence in 2027, with full adoption targeted for all taxpayers by the end of 2028.
Mr Bawa urged taxpayers yet to be onboarded onto the platform to begin the process and work with accredited service providers to ensure compliance.
On his part, Country Director of DigiTax Nigeria, Mr Olumide Akinsola, urged businesses to look beyond their internal systems and assess the compliance status of suppliers and counterparties.
He warned that businesses whose suppliers fail to transmit invoices through the MBS platform risk losing eligibility to claim Value Added Tax (VAT) input credits on such transactions, describing the resulting supply chain exposure as a significant commercial risk that many organisations have yet to quantify.
Mr Akinsola also announced the launch of DigiTax’s white paper, The State of E-Invoicing Readiness in Nigeria, which examines compliance adoption trends and the readiness gap across different taxpayer segments.
He added that DigiTax operates in Nigeria, Kenya, Zambia and the United Arab Emirates (UAE), noting that experience from those markets shows businesses that integrate early are better positioned to avoid disruptions when enforcement begins.

By Aduragbemi Omiyale
The names of about 100,000 companies registered by the Corporate Affairs Commission (CAC) are about to be deleted for inactivity, especially for failing to file their annual tax returns, Business Post reports.
This information was disclosed by the CAC via a notice signed by its management on Wednesday, July 15, 2026.
The list contains organisations like the Nigeria-Poland Chamber of Trade Invest Ltd, Alariwo of Afrika Ltd, Ovation Sports International, First Union Pension Fund Administrators, Investopedia Limited, Baptist High School Abuja Ltd, and Yobe Aluminium Manufacturing Industries Ltd, amongst others.
In the statement, the commission said its decision to strike off the names of the affected firms from the register aligns with the provisions of Section 692(3) (3) and (4) of the Companies and Allied Matters Act (CAMA), 2020.
However, the affected companies can still salvage the situation by filing all outstanding annual returns and regularising their records within 90 days.
“Please note that companies that fail to comply within the stipulated timeline shall be struck off the register without further notice,” it declared, expressing its continued commitment to providing prompt and efficient registration and regulatory services to the satisfaction of its valued customers.

By Adedapo Adesanya
The NASD Over-the-Counter (OTC) Securities Exchange gained 1.75 per cent on Wednesday, July 15, pushing the NASD Security Index (NSI) up by 74.20 points to 4,316.51 points from 4,242.31 points, as the market capitalisation added N44.54 billion to finish at N2.590 trillion compared with the preceding session’s N2.546 trillion.
During the session, there was an 11.5 per cent rise in the value of transactions at midweek to N72.7 million from the preceding session’s N65.2 million, as there was a 3.7 per cent growth in the number of deals to 28 deals from the previous session’s 27 deals, while the volume of securities slumped by 64.5 per cent to 4.9 million units from 13.7 million units.
At the close of trades, Great Nigeria Insurance (GNI) Plc ended as the most active security by value on a year-to-date basis, with 3.4 billion units worth N8.4 billion, with the second spot occupied by Infrastructure Credit Guarantee (Infracredit) Plc after selling 2.3 billion units valued at N6.5 billion, and the third position was taken by Central Securities Clearing System (CSCS) Plc, which exchanged 74.3 million units for N5.3 billion.
GNI Plc also finished the trading day as the most traded stock by volume on a year-to-date basis, with a turnover of 3.4 billion units traded for N8.4 billion, followed by Infracredit Plc with 2.3 billion units transacted for N6.5 billion, and Resourcery Plc with 1.1 billion units sold for N415.7 million.
Business Post reports that the market breadth index was negative yesterday, as there were two price gainers and three price losers.
11 Plc added N22.36 to its value to close at N250.00 per share versus N227.64 per share, and CSCS Plc improved by N7.95 to N90.35 per unit from N82.40 per unit.
On the flip side, FrieslandCampina Wamco Nigeria Plc lost N1.37 to end at N150.00 per share versus N151.37 per share, UBN Property Plc depreciated by 6 Kobo to N1.75 per unit from N1.81 per unit, and Food Concepts Plc dropped 1 Kobo to close at N2.49 per share versus N2.50 per share.
