
Economy
Stock Analysis: UBA Plc, Upward Revision to 2017F Estimates; BUY
In its recently released H1-17 results, UBA recorded a significant growth in gross earnings (+34.51% y/y), driven by impressive growth across income lines– interest income (+44.25%) and non-interest revenue (+16.01%).
Over H2, we believe the improved yields on interest earning assets (expanded 205 bps to 12.32% in H1-17) – from repricing of loans and elevated yields on investment securities – will remain robust.
Hence, for 2017F, we forecast 50 bps y/y expansion in asset yield to 12.15%, resulting in interest income growth of 22.18% y/y to N322.53 billion.
On NIR, we believe the gains on FX trading (due to fx related gains and derivative transactions) and growth in fixed income securities trading will persist for the rest of the year (albeit marginal over H2), and as a result, we forecast NIR growth of 24.90% y/y to N132.01 billion for 2017F.
Accordingly, we have raised our gross earnings growth forecast higher to 49.44% y/y (previously 30.28%) in 2017F to N470.50 billion.
On funding cost, we have reviewed our 2017F cost of funds estimate 43 bps higher to 4.11%, translating to an interest expense growth of 27.82% y/y to N126.25 billion. Our upward review is driven by the surge in interest charge on borrowings – a development we attribute to the bank’s recently issued USD500 million Eurobond at a yield of 7.875% and a range of bilateral facility secured during the year – and Fed Rates hikes impact on LIBOR linked borrowings.
Note that these drove 38 bps y/y rise in cost of funds to 3.75% in H1-17.
However, we believe the strong yields on interest earning assets will outweigh the expansion in funding cost, thus, we estimate net interest margin to advance 32 bps y/y to 7.02%.
In H1-17, loan loss provision (+104.25% q/q and 8.94% y/y) surged, resulting in 129 bps y/y uptick in cost of risk to 1.93% (NPL came in ahead of 2016 level at 4.20% in H1-17), above management’s 1.5% guidance for 2017F.
The expansion in cost of risk during the period stemmed from an additional N8.57 billion provision for specific credit loss impairment, which we believe relates to exposure to general commerce, manufacturing, oil & gas, and power.
At 4.2% in H1-17, NPL was well-ahead of 2016FY’s 3.90%. For 2017F, we estimate UBA’s NPL to increase to 4.80%, from 3.90% in FY-16, and cost of risk is expected to remain elevated over H2-17, to 2.00% by year end, translating to a credit loss provision of N32.04 billion in 2017F.
Despite the impact of both the change in the treatment of AMCOM levy (which resulted in a one-off charge on other opex) and the increases in personnel expenses and depreciation expense on total opex (37.35% y/y), efficiency measures still improved over H1-17 (supported by the significant growth in operating income), with cost to income ratio contracting 80 bps to 58.60%.
For the rest of the year, we believe cost will moderate across key lines, thus, we forecast 22.22% y/y growth in opex to N186.38 billion, translating to a 593 bps y/y contraction in cost to income ratio to 56.77%, while we expect operational leverage to rise to 5.1x, compared to 4.9x in FY-16.
Overall, we forecast PBT and PAT growth of 74.51% and 14.28% to N109.87 and N82.58 billion respectively, equating to 14.28% expansion in EPS (2017F: N2.28).
UBA’s FX related gains have been largely buoyed by its sizeable FCY position from the issuance of Eurobond and inflows from other FCY borrowings during the year. The balance sheet as at H1-17 reveals that FCY borrowings worth USD405.46 million (Citi Bank Syndicated Facility USD30.46 million, Africa Trade Finance Limited USD75 million and Credit Suisse Tranche A & B USD300 million) are due for maturity between August and December 2017.
As such, we believe PAT growth will be marginal over 2018-2019F, as FX related and revaluation gains taper and NIR contribution to gross earnings contract.
Following the upward adjustment to EPS, we raised our target price by 12.17% to N12.62 (previous: N11.25) and rolled forward our valuation to 2018.
Our current 12-month TP implies upside potential of 31.59% from current levels; consequently, we recommend a BUY on the stock.
UBA is currently trading at 2017F P/BVPS of 0.7x (below the peer average of 0.9x, but in line with the 5-year average of 0.7x) and 2017 FP/E of 4.5x (below the peer average of 5.5x, but above the 5-year average of 3.1x).

By Adedapo Adesanya
The chief executive of HBM Nigeria Plc (formerly Lafarge Africa), Mr Lolu Alade-Akinyemi, said the cement producer is expected to add 4.5 million tonnes to its production capacity by January 2027.
HBM Nigeria Plc is positioning itself for stronger long-term competitiveness, market leadership and job creation as it accelerates expansion projects.
The transition to HBM Nigeria marks a new phase of growth, driven by operational excellence, sustainability, innovation, and infrastructure development, while maintaining its long-standing commitment to Nigeria’s construction sector.
Mr Alade-Akinyemi, speaking recently in Lagos, said the ongoing expansion of the company’s Ashaka and Sagamu plants would significantly boost local production, create employment opportunities, and support businesses across its value chain.
“We recently announced the expansion of the Sagamu plant in Ogun State and the Ashaka plant in Gombe State. Hopefully, in January 2027, we will commission both plants, adding 4.5 million tonnes to our capacity. Traditionally, building a new plant takes about three years, but this is one of the benefits of belonging to the Huaxin Group,” he said.
According to him, the projects will generate employment, create opportunities for young people and women, strengthen local suppliers and contractors, and contribute further to Nigeria’s economic growth.
“There are many vacancies we are trying to fill in Sagamu and Ashaka. Beyond direct employment, we are creating opportunities for small businesses, developing suppliers and supporting local contractors. This is an exciting period because it will deliver significant benefits to Nigeria,” he said.
Mr Alade-Akinyemi noted that while the company’s corporate identity had changed following its acquisition by Huaxin Building Materials Group, its core values and commitment to customers, host communities, employees and shareholders remain unchanged.
He said HBM Nigeria traces its roots to 1959 as West African Portland Cement Company (WAPCO), with its first cement plant commencing operations in Ewekoro, Ogun State, in 1961.
Since then, he said, the company has grown into one of Nigeria’s leading building solutions providers with integrated plants in Ewekoro, Sagamu, Ashaka and Mfamosing.
He added that the company, which became publicly listed in 1979, has continued to expand through acquisitions and transformation while maintaining high product quality, innovation and responsible operations.
Highlighting the strengths of its parent company, Alade-Akinyemi described Huaxin Building Materials as a globally recognised building materials manufacturer founded in 1907 and headquartered in Wuhan, China, with operations across 16 regions in China and 14 countries worldwide.
He said Huaxin’s engineering expertise and focus on research and development would strengthen HBM Nigeria’s operations and help close engineering skills gaps in the country.
“As HBM Nigeria, we are strategically positioned for long-term competitiveness and stronger market leadership while reinforcing our commitment to supporting Nigeria’s infrastructure development and economic progress after more than six decades of industry leadership,” he said.
He also said sustainability would remain central to the company’s operations, noting that it had introduced lower-carbon products and continued to invest in environmentally friendly production processes.
By Adedapo Adesanya
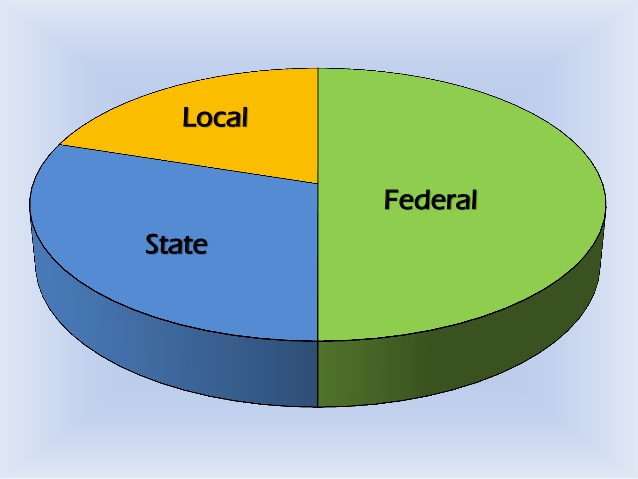
The Federation Account Allocation Committee (FAAC) distributed about N2.550 trillion from the revenue generated by the nation in June 2026 to the three tiers of government after its July meeting in Abuja.
A statement signed by the Director of Press in the Office of the Accountant General of the Federation, Mr Bawa Mokwa, “The N2.550 trillion total distributable revenue comprised N1.809 trillion in distributable statutory revenue and N740.724 billion in distributable Value Added Tax (VAT) revenue.”
It was gathered that a total gross revenue of N4.500 trillion was available in June 2026, with deductions for the cost of collection amounting to N160.744 billion, and transfers and refunds at N1.789 trillion.
According to a communiqué after the gathering, gross statutory revenue of N3.700 trillion was received in June 2026, N1.049 trillion higher than the N2.651 trillion received in the preceding month, while gross revenue of N799.746 billion was generated from VAT, N56.058 billion higher than the N743.688 billion recorded in May 2026.
It was stated that from the N2.550 trillion total distributable revenue, the federal government received N923.438 billion, the state governments got N838.208 billion, while the local government councils were given N591.390 billion, with N197.610 billion allocated to the benefiting states as 13 per cent of mineral derivation revenue.
From the N1.809 trillion distributable statutory revenue, the federal government went away with N849.366 billion, states shared N430.810 billion, local councils took N332.136 billion, while the benefiting states got N197.610 billion as derivation revenue.
From the N740.724 billion distributable VAT earnings, the central government got N74.072 billion, the states received N407.398 billion, and the local government councils were allocated N259.253 billion.
The communiqué further stated that in June 2026, collections from Companies Income Tax (CIT), Capital Gains Tax (CGT), Stamp Duties (SDT), Petroleum Royalties, Gas Flare Penalties, Rent, Mineral Oil Royalties (MOR), Value Added Tax (VAT), Import Duty, and Common External Tariff (CET) Levies increased significantly, while Petroleum Profit Tax (PPT), Hydrocarbon Tax (HT), Mineral Royalties, and Fees declined considerably. Excise Duty recorded only a marginal increase.
By Adedapo Adesanya
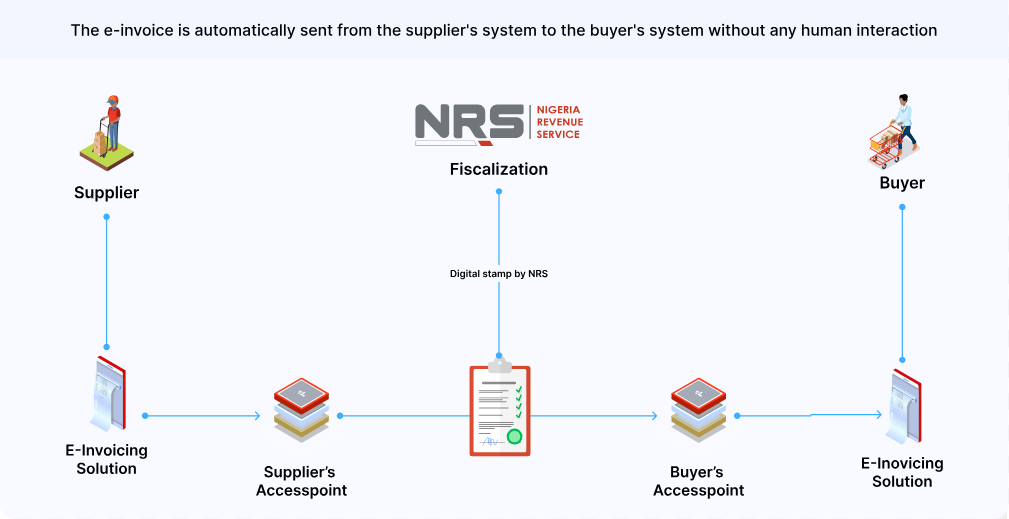
The Nigeria Revenue Service (NRS) says the rollout of electronic invoicing (e-invoicing) will strengthen tax compliance, curb revenue leakages and improve transparency in tax administration as it moves to fully digitise the country’s tax system.
The Project Lead for the NRS e-Invoicing Project, Mr Mohammed Bawa, stated this at the DigiTax E-Invoicing Compliance Breakfast Session held in Lagos on Wednesday.
The event, organised by DigiTax, an NRS-accredited e-invoicing platform, formed part of efforts to support the agency’s ongoing education and sensitisation campaign on the e-invoicing mandate.
Mr Bawa said the initiative aligns with global trends in tax digitisation and is expected to help improve Nigeria’s tax-to-GDP ratio, which remains one of the lowest in Africa.
According to him, the system will provide the NRS with greater visibility into transactions across sectors, formalise activities within the informal economy and standardise invoice formats nationwide using globally recognised invoice schemas.
He added that e-invoicing would improve operational efficiency for both businesses and tax authorities while supporting the NRS’ transition from manual and electronic tax administration processes to a fully automated system-to-system interaction model.
Mr Bawa noted that the legal framework for implementation is backed by the Nigeria Tax Administration Act, which prescribes penalties for non-compliance.
He disclosed that the NRS has completed onboarding large taxpayers and is preparing to enforce compliance with defaulting entities.
According to him, medium taxpayers are expected to begin compliance in the third quarter of 2026, while onboarding of emerging taxpayers will commence in 2027, with full adoption targeted for all taxpayers by the end of 2028.
Mr Bawa urged taxpayers yet to be onboarded onto the platform to begin the process and work with accredited service providers to ensure compliance.
On his part, Country Director of DigiTax Nigeria, Mr Olumide Akinsola, urged businesses to look beyond their internal systems and assess the compliance status of suppliers and counterparties.
He warned that businesses whose suppliers fail to transmit invoices through the MBS platform risk losing eligibility to claim Value Added Tax (VAT) input credits on such transactions, describing the resulting supply chain exposure as a significant commercial risk that many organisations have yet to quantify.
Mr Akinsola also announced the launch of DigiTax’s white paper, The State of E-Invoicing Readiness in Nigeria, which examines compliance adoption trends and the readiness gap across different taxpayer segments.
He added that DigiTax operates in Nigeria, Kenya, Zambia and the United Arab Emirates (UAE), noting that experience from those markets shows businesses that integrate early are better positioned to avoid disruptions when enforcement begins.
