
Connect with us

Economy

Understanding Stock Market Trends: What Investors Need to Know

Published

on

stock market trends

Introduction to Stock Market Trends

The stock market is a complex and dynamic system where equities are bought and sold. Understanding these trends is crucial for any investor aiming to maximise returns and minimise risks. This article provides a deep dive into the mechanisms of stock market trends, indicators, and strategies for both new and seasoned investors.

What are Stock Market Trends?

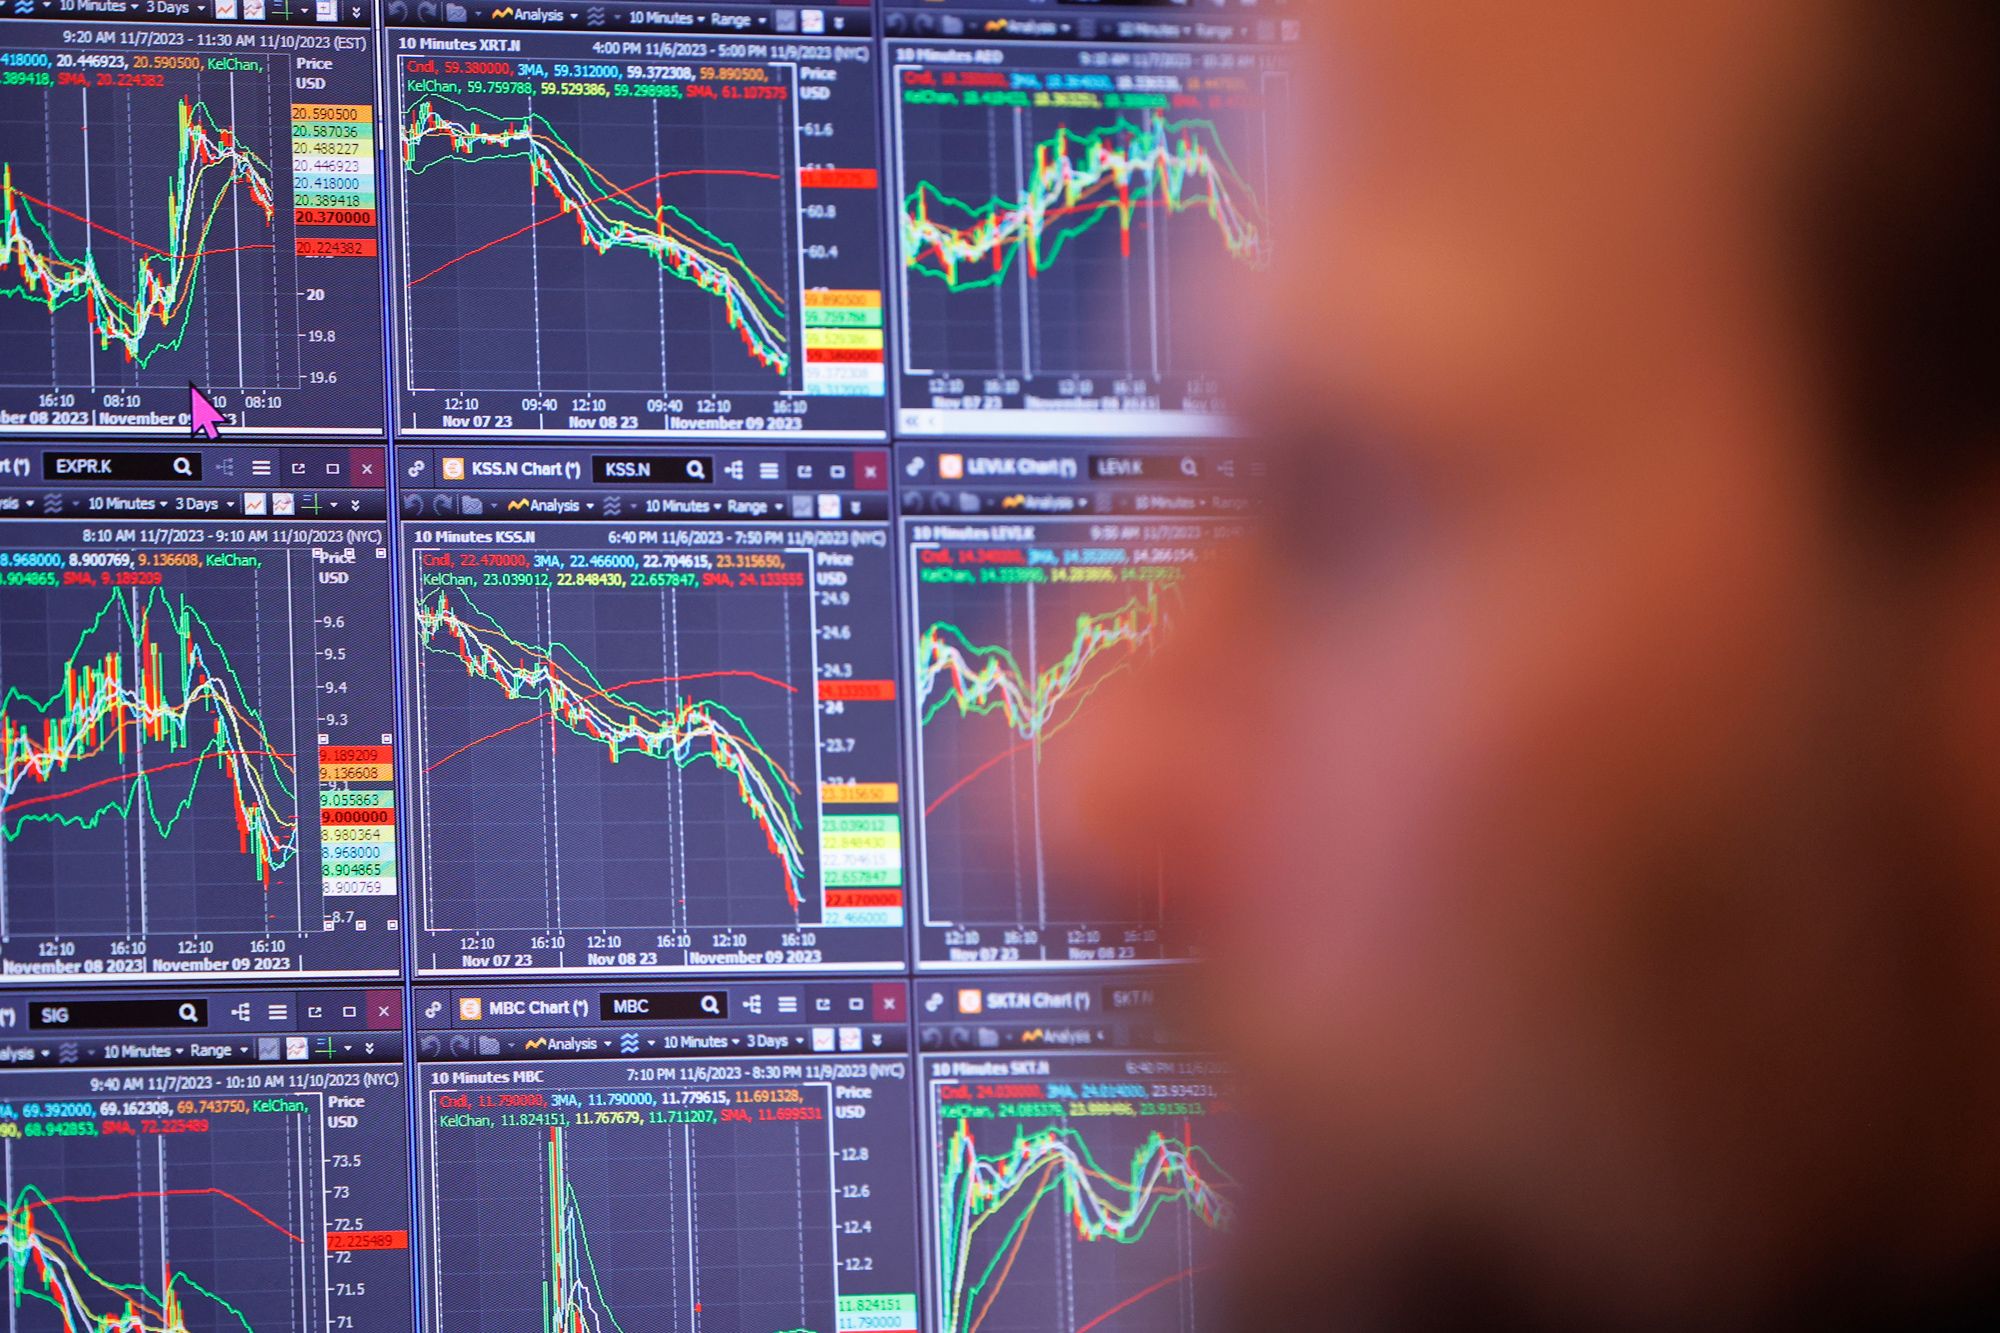
A stock market trend is a perceived tendency of financial markets to move in a particular direction over time. These trends are classified into three types: upward (bullish), downward (bearish), and sideways (flat). Identifying these trends and their duration helps investors make informed decisions.

Key Indicators to Identify Market Trends

  1. Moving Averages:

A moving average smooths out price data by creating a constantly updated average price. The two commonly used moving averages are the Simple Moving Average (SMA) and the Exponential Moving Average (EMA). These indicators help reveal the trend direction and provide insights on potential reversals.

  1. Momentum Indicators:

Momentum indicators like the Relative Strength Index (RSI), MACD (Moving Average Convergence Divergence), and Stochastic Oscillator are used to assess the speed of price changes, which can indicate the strength of a trend.

  1. Volume Indicators:

Volume plays a pivotal role in understanding market trends. High volume points to a high interest in a stock at its current price and is often associated with the continuation of current trends. Volume Oscillators and On-Balance Volume (OBV) provide insights into the strength of market trends.

Strategies for Trading Market Trends

  1. Trend Following:

This strategy involves identifying the direction of the market trend and making trades based on the expectation that the trend will continue. It is one of the most popular and simplest strategies for capitalizing on market movements.

  1. Trend Reversal Trading:

Contrary to trend following, trend reversal trading aims to identify the point where a trend ends and a new one begins. Tools like the Fibonacci Retracement can help identify potential reversal points.

  1. Breakout Trading:

This strategy focuses on entering the market as the stock breaks beyond a predefined level of resistance or support, which is usually accompanied by increased volume.

Long-Term Investment vs. Short-Term Trading

Long-term investors will benefit from recognizing macro trends that last for years. These investors typically rely on fundamental analysis combined with trend data to make their investment choices.

Short-term traders, on the other hand, capitalize on fluctuations within these broader trends. They utilize a combination of technical indicators and market sentiment to guide their trading decisions.

Impact of Economic Indicators on Stock Market Trends

Economic indicators such as GDP growth rates, unemployment rates, and inflation are pivotal in shaping market trends. For instance:

Positive GDP Reports generally bolster investors’ confidence, pushing markets higher.

High Unemployment can trigger a bearish trend as it suggests a slowing economy.

Psychological Factors Influencing Market Trends

The stock market is not just influenced by economic indicators, but also by the psychological and emotional state of investors. Greed and fear are the primary emotions driving market volatility. Recognizing these emotional cues is essential for predicting market movements.

Conclusion

Understanding stock market trends is fundamental for anyone involved in investing. By utilizing key indicators to identify trends, and adapting suitable trading strategies, investors can improve their chances of success. Whether you are a long-term investor or a short-term trader, grasping these concepts will equip you with the tools to navigate through the complexities of the stock market effectively.


Click to comment

Leave a Reply

Your email address will not be published. Required fields are marked *

Economy

NASD OTC Market Gains 2.3%, Adds N58bn to Investors’ Wealth

Published

on

NASD OTC market

By Adedapo Adesanya

The NASD Over-the-Counter (OTC) Securities Exchange rose by 2.30 per cent, spurring the NASD Security Index (NSI) to close higher by 96.61 points to 4,296.34 points from 4,199.73 points, and raising the market capitalisation by N57.99 billion to N2.578 trillion from N2.521 trillion.

The market was up yesterday despite a lower activity level, as the volume of securities traded slumped by 94.7 per cent to 1.3 million units from the previous 23.9 million units. The value of securities slipped by 57.2 per cent to N29.2 million from the preceding session’s N68.2 million, while the number of deals executed by market participants increased by 6.7 per cent to 32 deals from the 30 deals carried out on Thursday.

At the close of transactions, Great Nigeria Insurance (GNI) Plc remained the most traded stock by value on a year-to-date basis, with a turnover of 3.4 billion units worth N8.4 billion, trailed by Infrastructure Credit Guarantee (Infracredit) Plc with 2.3 billion units valued at N6.5 billion in trades, and Central Securities Clearing System (CSCS) Plc with 70.8 million units traded for N4.9 billion.

GNI Plc was also the most traded stock by volume on a year-to-date basis, with 3.4 billion units sold for N8.4 billion, followed by Infracredit Plc with 2.3 billion units exchanged for N6.5 billion, and Resourcery Plc with 1.1 billion units transacted for N415.7 million.

During the trading day, there were three price gainers and two price losers, led by Afriland Properties Plc, which shed N1.48 to sell at N15.17 per share compared with the previous session’s N16.65 per share, and Food Concepts Plc, which slid by 7 Kobo to close at N2.69 per unit versus N2.76 per unit.

Conversely, FrieslandCampina Wamco Nigeria Plc improved its value by N9.50 to trade at N150.00 per share compared with Thursday’s closing price of N140.50 per share, CSCS Plc went up by N7.95 to N89.65 per unit from N81.70 per unit, and 11 Plc soared by N6.94 to N206.95 per share from N200.01 per share.

Continue Reading

Economy

Guinness Nigeria, Others Drown Stock Exchange by 0.07%

Published

on

exposure to Nigerian stocks

By Dipo Olowookere

The Nigerian Exchange (NGX) Limited lost its footing by 0.07 per cent on Friday as a result of renewed profit-taking by investors.

The fall happened after Thomas Wyatt and Guinness Nigeria led other price losers group comprising 27 stocks at the market yesterday due to selling pressure.

Thomas Wyatt Nigeria shed 10.00 per cent to quote at N2.70, Guinness Nigeria drowned by 9.99 per cent to close at N329.00, Ikeja Hotel slipped by 9.96 per cent to N42.50, Zichis shed 9.94 per cent to trade at N26.37, and McNichols depreciated by 9.91 per cent to N5.00.

On the flip side, International Breweries gained 9.92 per cent to finish at N13.30, NEM Insurance appreciated by 9.61 per cent to N27.95, Jaiz Bank grew by 6.36 per cent to N9.20, UPDC expanded by 6.33 per cent to N4.20, and Livestock Feeds increased by 6.32 per cent to N9.25.

Business Post reports that investor sentiment remained bullish despite the loss recorded during the session, as there were 27 price decliners and 30 price advancers, representing a positive market breadth index.

Yesterday, market participants transacted 441.3 million equities for N19.4 billion in 44,938 deals compared with the 1.7 billion equities worth N112.0 billion traded in 44,780 deals a day earlier. This showed that the trading volume contracted by 74.04 per cent, the trading value declined by 82.68 per cent, and an uptick in the number of deals by 0.35 per cent.

Access Holdings led the activity chart on Friday after selling 40.2 million shares valued at N1.0 billion, Sterling Holdco traded 30.3 million stocks worth N228.8 million, Fidelity Bank sold 26.3 million equities for N505.6 million, Zenith Bank transacted 22.3 million shares valued at N2.5 billion, and First Holdco exchanged 19.0 million stocks worth N1.3 billion.

During the last trading session of the week, the consumer goods sector rose by 0.49 per cent, the insurance counter increased by 0.06 per cent, and the industrial goods index closed flat, while the banking and energy indices lost 0.78 per cent and 0.52 per cent, respectively.

As a result, the All-Share Index (ASI) shrank by 159.97 points to 243,798.76 points from 243,958.73 points, and the market capitalisation moderated by N103 billion to N156.445 trillion from N156.548 trillion.

Continue Reading

Economy

Naira Closes Weaker at N1,379/$1 in Official Market

Published

on

sellers of Naira

By Adedapo Adesanya

The Naira performed poorly against the United States Dollar in the Nigerian Autonomous Foreign Exchange Market (NAFEX) on Friday, July 10, losing N1.19 or 0.09 per cent to close at N1,379.62/$1, in contrast to Thursday’s exchange rate of N1,378.43/$1.

It also depreciated against the Pound Sterling in the official market during the trading session by N3.80 to trade at N1,850.62/£1 compared with the previous day’s N1,846.82/£1, but gained 43 Kobo on the Euro to sell at N1,575.66/€1 versus the preceding day’s N1,576.09/€1.

At the GTBank FX desk, the Naira weakened against the Dollar yesterday by N1 to quote at N1,386/$1 compared with the previous session’s N1,835/$1, and maintained stability in the black market at N1.400/$1.

Data showed that interbank FX turnover fell by about 10 per cent on Friday to $71.044 million from $78.708 million the previous day. Also, interbank forex market deals reduced to 87 from 106 trades executed at the window on Thursday.

The total forex inflows into the Nigerian foreign exchange market have been fluctuating, with about $1 billion in total inflows reported last week.

Total FX inflows settled at $0.99 billion last week, according to the research subsidiary of Coronation Merchant Bank, with Foreign Portfolio Investors (FPIs) accounting for the largest share at 35.81 per cent, or $0.35 billion.

Exporters accounted for 28.72 per cent or $0.28 billion, while the CBN contributed 11.15 per cent or $0.11 billion. Non-Bank Corporations also made up a notable 10.92 per cent of total inflows, reflecting continued support from both market-driven and official sources.

In the cryptocurrency market, Bitcoin rose above $64,100, retesting the price level that rejected it on Monday, with a clean break above, opening the path toward the June 15 high of $67,250. It gained 0.3 per cent to sell at $64,114.16.

Ethereum (ETH) appreciated by 1.6 per cent to $1,798.81, Dogecoin (DOGE) grew by 0.6 per cent to $0.0742, Binance Coin (BNB) added 0.6 per cent to sell for $576.47, Cardano (ADA) also grew by 0.6 per cent to $0.1674, and Ripple (XRP) jumped by 0.4 per cent to $1.10.

But Solana (SOL) lost 1.1 per cent to settle at $77.95, and TRON (TRX) declined by 0.2 per cent to $0.3296, while the US Dollar Tether (USDT) and the US Dollar Coin (USDC) remained unchanged at $1.00 apiece.

Continue Reading