
Media OutReach
Results of the ixCrypto Index Series Quarterly Review (2024 Q4) & IX Digital Asset Industry Index Series Half Yearly Review (2024 2H)
1. Constituent Review – ixCrypto Index Series
1.1 ixCrypto Index (“IXCI”)
The number of constituents will remain unchanged at 19 constituents with 2 additions and 2 deletions.
Additions
1. Stellar
2. Sui
Deletions
1. Aptos
2. Polygon
After the change, the free float adjusted market capitalization coverage is 82.62%*, while the 90-day-average volume is 77.39%* (excluding stable coin which has 6.21% of the total crypto universe). The constituents change above and recapping at 40% will be effective on 17 January 2025 (Friday).
Since the last review, there has been an increase in the crypto total market capitalization from USD2.17tn to USD2.89tn (+33.18%)#, and a increase in the daily volume from USD71.42bn to USD152.20bn (+113.11%)#. Bitcoin remains as the largest crypto in the constituent list, with its price has increased by 41.15% since the last review.
1.2 ixCrypto Portfolio Indexes
1.2.1 ixCrypto 5 Equal Weight Index (“IXEW5”) and ixCrypto 5 Square Root Index (“IXSR5”)
Addition
No addition
Deletion
No deletion
1.2.2 ixCrypto 10 Equal Weight Index (“IXEW10”) and ixCrypto 10 Square Root Index (“IXSR10”).
Addition
No addition
Deletion
No deletion
1.2.3 ixCrypto Altcoin 10 EW Index (“IXAEW10”) and ixCrypto Altcoin 10 SR Index (“IXASR10”).
Addition
1. Chainlink
Deletion
1. Polkadot
1.3 ixCrypto BTC/ETH Indexes
As of 31st December 2024, the market capitalization represented by the two indexes IX Bitcoin Index (IXBI) and IX Ethereum Index (IXEI) in ixCrypto BTC/ETH 5050 Index (“IX5050”) was 40.99%/59.01% respectively, a change from 43.69%/56.31% from 30th September 2024.
As of 31st December 2024, the market capitalization represented by the two indexes IXBI and IXEI in ixCrypto BTC/ETH Proportional Index (“IXPI”) was 43.69%/56.31% respectively, a change from 40.99%/59.01% from 30th September 2024.
The weight of IXBI & IXEI will be adjusted to 81.60%/18.40% respectively, at effective date 17th January 2025 from 78.19%/21.81% on 18th October 2024 (last effective date).
2. Constituent Review- IX Digital Asset Industry Index Series
2.1 ixCrypto Stablecoin Index
The number of constituents will increase to 5 with 1 addition and no deletion. Stable coin comprises 6.21% of the total crypto universe, and ixCrypto Stablecoin Index covers around 99.26% of the 90-day average market capitalization in stablecoin universe.
Addition
1. Ethena USDe
Deletion
No deletion
2.2 ixCrypto Infrastructure Index
The number of constituents will increase to 23 constituents, with 2 additions and no deletions.
Additions
1.Sui
2. Fantom
Deletion
No deletion
3. Exchange Review
As a result of exchange review, 10 exchanges passed the review process, which are as follows:
Passed Exchanges
1. Binance
2. Bitrue (New)
3. Bybit (New)
4. Upbit
5. Whitebit
6. Coinbase Advanced
7. OKEX
8. Gate.io
9. DigiFinex
10. Bitget
Removed Exchanges
1. P2PB2P
2. Huobi Global
The selected 10 exchanges will be taken to generate each of the fair average prices for the IX indexes’ constituents. The exchange review covers volume rankings, exchange background checking, founders’ background checking, USD/USDT/USDC/BTC pairs coverage, overconcentration rules, exchange API coverage checking and stability etc for an exchange.
After the meeting, IX Asia Indexes announces that the IX Asia Indexes will adopt a revised exchange selection methodology to reduce the number of selected exchanges from 10 to 8. This means each index constituent’s price will be an average of 8 instead of 10. This change has been approved by the IX Asia Indexes Index Advisory Committee and will take effect together with the next quarter’s review effective date in April 2025. The revision aims to raise the data stability and exchanges credit ratings that already have high market volume coverage. This strategic update reinforces our commitment to providing accurate, reliable, and high-quality benchmarks for the digital asset market.
For more details about our exchange selection criteria, please email in**@******ex.com
More details about the ixCrypto index, including their constituents, constituents’ weight are provided in the Appendices, or refer to the website https://ix-index.com/
*Exclude stable coins and exchange coins (based on conflict-of-interest rule methodology effective Oct 2, 2020)
#As of 31 December 2024, based on past 90 days average
Appendix 1
ixCrypto Index (“IXCI”)
| Universe | All crypto coins traded in at least two different exchanges around the world |
| Selection Criteria | Cryptocurrencies ranking in the top 80% of cumulative full market capitalization (“MC”) coverage and within an acceptable range in accordance with the Volume Buffer Rule in terms of 90-day average trading volume |
| Number of Constituents | Variable/19 in Q4 2024 |
| Launch Date | 12th December 2018 |
| Base Date | 3rd December 2018 |
| Base Value | 1,000 |
| Reconstitution Rule | If the coverage is below 75% or any of constituents is not within an acceptable range in accordance with the Volume Buffer Rule in terms of 90-day average trading volume, IXCI will be reconstituted to bring MC coverage back and do liquidity screening. |
| Reconstitution and Rebalancing Frequency | Quarterly and with a fast entry rule |
| Weighting Methodology | Free float adjusted market capitalization weighted with a cap of 40% |
| Currency | US Dollar |
| Dissemination | Every 5 seconds for 24×7 |
| Website | https://ix-index.com/ |
Appendix 2
| Crypto | 90-day-average- Market Cap | 90-day-average-volume * | Cut-off
Price |
Cumulative
Market Coverage before Cap |
Weighting (%) After 40% Cap# | |
| 1 | Bitcoin | $ 1,653,346,686,963 | $55,700,564,812 | 92643.21 | 57.19% | 40.00% |
| 2 | Ethereum | $ 372,904,493,611 | $28,923,854,773 | 3356.39 | 70.09% | 28.97% |
| 3 | Solana | $ 92,517,695,642 | $4,696,383,712 | 191.03 | 73.29% | 6.57% |
| 4 | XRP | $ 73,519,084,861 | $8,093,922,867 | 2.06 | 75.84% | 8.46% |
| 5 | Dogecoin | $ 40,671,209,916 | $5,987,716,000 | 0.31 | 77.24% | 3.31% |
| 6 | Cardano | $ 24,222,742,887 | $1,588,004,259 | 0.86 | 78.08% | 2.17% |
| 7 | TRON | $ 17,918,987,041 | $1,106,336,563 | 0.25 | 78.70% | 1.56% |
| 8 | Avalanche | $ 14,453,177,241 | $752,645,851 | 35.91 | 79.20% | 1.05% |
| 9 | Toncoin | $ 14,198,145,889 | $326,520,961 | 5.58 | 79.69% | 1.02% |
| 10 | Shiba Inu | $ 13,201,346,341 | $1,259,766,322 | 0.00 | 80.15% | 0.89% |
| 11 | Chainlink | $ 10,523,400,832 | $951,515,621 | 20.58 | 80.51% | 0.94% |
| 12 | Polkadot | $ 9,415,826,014 | $570,815,666 | 6.70 | 80.84% | 0.74% |
| 13 | Sui | $ 8,871,169,768 | $1,522,100,374 | 4.18 | 81.15% | 0.88% |
| 14 | Bitcoin Cash | $ 8,574,389,714 | $566,961,600 | 443.34 | 81.44% | 0.63% |
| 15 | Stellar | $ 7,631,351,513 | $1,046,598,022 | 0.33 | 81.71% | 0.72% |
| 16 | Litecoin | $ 6,706,780,617 | $857,128,864 | 99.31 | 81.94% | 0.54% |
| 17 | NEAR Protocol | $ 6,651,505,963 | $602,999,876 | 5.04 | 82.17% | 0.43% |
| 18 | Pepe | $ 6,605,970,390 | $2,739,283,209 | 0.00 | 82.40% | 0.55% |
| 19 | Uniswap | $ 6,444,330,873 | $497,335,285 | 13.32 | 82.62% | 0.57% |
Weightings of the Constituents of ixCrypto Index
As of 31 December 2024
* 90-day-average-volume ranking in total market is shown in the parentheses
# Weighting (%) after 40% Cap is adjusted according to the cut-off price, the arrangement of order may not be the same as 90-day-average-Market Cap
Selection of index constituents is based on the past 90-day-average market capitalization and volume.
For the calculation methodology of the index, please refer to the “ixCrypto Index Methodology Paper” on our website
Appendix 3
Weightings of the Constituents of ixCrypto Portfolio Indexes
| Index Constituents | ixCrypto 5 EW Index | ixCrypto 5 SR Index | ixCrypto 10 EW Index | ixCrypto 10 SR Index | ixCrypto Altcoin 10 EW Index | ixCrypto
Altcoin 10 SR Index |
|
| 1 | Bitcoin | 20.00% | 47.50% | 10.00% | 38.42% | – | – |
| 2 | Ethereum | 20.00% | 22.30% | 10.00% | 18.04% | 10.00% | 27.82% |
| 3 | Solana | 20.00% | 10.62% | 10.00% | 8.59% | 10.00% | 13.25% |
| 4 | XRP | 20.00% | 12.05% | 10.00% | 9.75% | 10.00% | 15.04% |
| 5 | Dogecoin | 20.00% | 7.53% | 10.00% | 6.10% | 10.00% | 9.41% |
| 6 | Cardano | – | – | 10.00% | 4.93% | 10.00% | 7.61% |
| 7 | TRON | – | – | 10.00% | 4.19% | 10.00% | 6.46% |
| 8 | Avalanche | – | – | 10.00% | 3.44% | 10.00% | 5.31% |
| 9 | Toncoin | – | – | 10.00% | 3.38% | 10.00% | 5.22% |
| 10 | Shiba Inu | – | – | 10.00% | 3.16% | 10.00% | 4.88% |
| 11 | Chainlink | – | – | – | – | 10.00% | 5.00% |
Appendix 4
Weightings of the Constituents of ixCrypto BTC/ETH 50/50 Index
and ixCrypto BTC/ETH Proportional Index
| 90-day-average Crypto Market Cap | 90-day-average Crypto Volume | Index Level | Cumulative Market Cap Coverage | Weight in BTC/ETH 50/50 | Weight in BTC/ETH Proportional | |
| IXBI | $1,653,346,686,963 | $55,700,564,812 | $22373.87 | 57.19% | 50.00% | 81.60% |
| IXEI | $ 372,904,493,611 | $28,923,854,773 | $ 28838.88 | 70.09% | 50.00% | 18.40% |
Appendix 5
Weightings of the Constituents of ixCrypto Infrastructure Index
| Crypto | 90-day-average- Market Cap | 90-day-average-volume * | Cut-off Price | Cumulative
Market Coverage before Cap |
Weighting (%) After 40% Cap# | |
| 1 | Ethereum | $ 372,904,493,611.13 | $28,923,854,773 | $3,356.39 | 12.90% | 40.00% |
| 2 | Solana | $ 92,517,695,641.63 | $4,696,383,712 | $191.03 | 16.10% | 21.06% |
| 3 | Cardano | $ 24,222,742,887.03 | $1,588,004,259 | $0.86 | 16.94% | 6.94% |
| 4 | TRON | $ 17,918,987,041.10 | $1,106,336,563 | $0.25 | 17.56% | 5.01% |
| 5 | Avalanche | $ 14,453,177,241.43 | $752,645,851 | $35.91 | 18.06% | 3.38% |
| 6 | Toncoin | $ 14,198,145,888.78 | $326,520,961 | $5.58 | 18.55% | 3.27% |
| 7 | Chainlink | $ 10,523,400,831.52 | $951,515,621 | $20.58 | 18.91% | 3.02% |
| 8 | Polkadot | $ 9,415,826,014.13 | $570,815,666 | $6.70 | 19.24% | 2.36% |
| 9 | Sui | $ 8,871,169,768.28 | $1,522,100,374 | $4.18 | 19.55% | 2.81% |
| 10 | NEAR Protocol | $ 6,651,505,962.99 | $602,999,876 | $5.04 | 19.78% | 1.35% |
| 11 | Aptos | $ 5,775,300,789.13 | $455,906,191 | $8.87 | 19.98% | 1.14% |
| 12 | Hedera | $ 5,570,631,325.54 | $862,787,795 | $0.28 | 20.17% | 2.44% |
| 13 | Internet Computer | $ 4,687,766,472.02 | $191,472,147 | $10.03 | 20.33% | 1.10% |
| 14 | Ethereum Classic | $ 3,722,758,894.98 | $398,857,535 | $25.41 | 20.46% | 0.88% |
| 15 | VeChain | $ 2,922,926,364.19 | $127,235,272 | $0.04 | 20.56% | 0.82% |
| 16 | Stacks | $ 2,906,816,986.95 | $213,096,487 | $1.49 | 20.66% | 0.52% |
| 17 | Arbitrum | $ 2,903,723,109.63 | $534,575,605 | $0.73 | 20.76% | 0.71% |
| 18 | Mantle | $ 2,810,706,862.04 | $119,998,236 | $1.20 | 20.86% | 0.93% |
| 19 | Cosmos | $ 2,435,639,693.81 | $273,561,507 | $6.34 | 20.94% | 0.57% |
| 20 | Optimism | $ 2,425,343,124.03 | $367,872,059 | $1.82 | 21.03% | 0.57% |
| 21 | Fantom | $ 2,414,473,266.10 | $416,274,281 | $0.73 | 21.11% | 0.47% |
| 22 | Injective | $2,345,116,959.18 | $187,573,289 | $20.04 | 21.19% | 0.45% |
| 23 | Polygon | $1,046,202,224.40 | $18,988,005 | $0.46 | 21.23% | 0.20% |
As of 31 December 2024
* 90-day-average-volume ranking in total market is shown in the parentheses
# Weighting (%) after 40% Cap is adjusted according to the cut-off price, the arrangement of order may not be the same as 90-day-average-Market Cap
Selection of index constituents is based on the past 90-day-average market capitalization and volume.
For the calculation methodology of the index, please refer to the “ixCrypto Index Methodology Paper” on our website.
Appendix 6
Weightings of the Constituents of ixCrypto Stablecoin Indexes
| Crypto | 90-day-average- Market Cap | 90-day-average- volume |
Cut-off Price |
Cumulative Market Coverage before Cap |
Weighting (%) After 40% Cap | |
| 1 | Tether USDT | $128,448,943,914 | $122,344,000,567 | $1.00 | 4.44% | 40.00% |
| 2 | USDC | $38,123,748,722 | $9,087,285,469 | $1.00 | 5.76% | 40.00% |
| 3 | Dai | $5,364,795,644 | $127,138,381 | $1.00 | 5.95% | 7.99% |
| 4 | Ethena USDe | $3,831,640,493 | $111,784,914 | $1.00 | 6.08% | 8.73% |
| 5 | First Digital USD | $2,344,937,137 | $6,974,820,760 | $1.00 | 6.16% | 3.28% |
As of 31 December 2024
Appendix 7
ixCrypto Indexes Dissemination
Real time indexes are disseminated every 5-second interval for 24×7 since 23 June 2022. The real-time indexes are available for viewing on the IX Crypto Index official webpage. For IXCI, IXBI and IXEI, the indexes are also available through Nasdaq Global Index Data Service (GIDS) with the tickers “IXCI”, “IXBI” and “IXEI”, with dissemination interval kept at 15-second unchanged.
The vendor tickers are shown below:
| Index Name | Bloomberg Ticker | Reuters Ticker |
| ixCrypto Index | IXCI | .IXCI |
| ixBitcoin Index | IXCBI | .IXBI1 |
| ixEthereum Index | IXCEI | .IXEI1 |
For further information about ixCrypto Index and other available indexes including IX Crypto spot price index series, please visit company official webpage https://ix-index.com or subscribe to LinkedIn: IX Asia Indexes
For data licensing and product, please contact us at li*******@******ex.com.
For free API use on academic research or trial, please contact en*****@******ex.com
Hashtag: #IXAsia #IXAsiaIndexes
The issuer is solely responsible for the content of this announcement.
About IX Asia Indexes and IX Asia Index Advisory Committee
IX Capital International Limited is an award-winning index and investment advisory company. The index business arm- IX Asia Indexes, providing real-time digital asset and innovative indexes, disseminated 24×7 globally and built on robust infrastructure. Since the launch of the first crypto benchmark index (“IXCI”) launched in Hong Kong in December 2018, the ixCrypto index series expand into 29 indexes designed for exchange futures product, mark to market and fund managers’ portfolio construction purposes. To ensure the professionality and impartiality of the index methodologies and operations, IX Asia Indexes has established its index advisory committee with representation from different industries, including fund management, exchanges, brokerage, financial blockchain experts, crypto service providers, etc. The committee will meet quarterly a year to discuss matters relating to the IX Asia Indexes, including to review and to comment the data sources, methodologies, and operations of IX Asia Indexes, to provide guidance to the future development of new IX Asia Indexes and to handle other issues and decisions on an as-needed basis.
IX Asia Indexes was awarded the Fintech Award (wealth investment and management) 2019 and 2021 organised by ETNet. It as well won an award for Startup of the Year and Basic Technology (Big Data) from Hong Kong Fintech Impetus Awards 2022 by Metro Broadcast and KPMG. It also won Asia Pacific Enterprise Achievement Award 2024 by Echolade. IX Asia Indexes completed its IOSCO compliance statement and obtained ISO/IEC 27001:2013 UKAS certification.
Website: https://ix-index.com/
Advisory Committee: https://ix-index.com/committee.htm
About IX Crypto Indexes
The ixCrypto index (“IXCI”) is the first crypto index launched in Hong Kong. It was launched on 12 December 2018. It is denominated in USD with a base value of 1000 and a base date on 3 December 2018. Designed to be easy to understand while providing a good representation of the crypto market, ixCrypto index aims to cover the top 80% of the cumulative free-float adjusted market capitalization in the crypto universe and, at the same time, the crypto currencies should fall within the top liquid cryptos ranked by trading volume in the 90 days preceding the review date. The index is to be reviewed quarterly and with a fast entry rule. Real time indexes are disseminated every 5-second for 24×7 since 23 June 2022. Real time index data together with ixBitcoin Index and ixEthereum Index can be obtained from IX Asia Indexes Data Services and Bloomberg terminal on IXCI <GO>. For IXCI, IXBI and IXEI, the indexes are also available through Nasdaq Global Index Data Service (GIDS) with the tickers “IXCI”, “IXBI”, “IXEI”, with dissemination interval kept at 15-second unchanged.
Media OutReach
SkinLab The Medical Spa Recognised at the 2026 Singapore Retailers Association Awards (SRA) for Excellence in Beauty and Cosmetics
For SkinLab, this reflects two decades of building a holistic beauty ecosystem spanning medical aesthetics, skin health, and wellness, under Dr Kelvin Chua, Senior Medical Director and Founder of SL Aesthetic Group. Treatments are personally developed by Dr Chua to address different skin concerns, such as acne, pigmentation, sensitivity, rosacea, dryness, and ageing. The medical spa also offers a range of skincare products formulated for Singapore’s humid climate and to support long-term skin health.
With 10 outlets islandwide, SkinLab has cared for more than 100,000 customers through this model of doctor-designed care. As no two skin conditions present the same way, each treatment can be customised to individual needs and preferences.
SkinLab has also been recognised by Harper’s BAZAAR, HerWorld, and Singapore Women’s Weekly for treatments targeting deep hydration, rejuvenation, and complexion correction. Behind these treatment outcomes are medical-grade technologies, including the LDM Triple, a triple-frequency ultrasound that targets multiple skin depths simultaneously; FDA-approved Lumenis M22 IPL system for photorejuvenation and pigmentation; Onda Pro with Coolwaves™ technology for body contouring; and the globally-recognised HydraFacial.
The medical spa continuously invests in technology that improves the customer experience, including using AI-assisted skin analysis to support consultations alongside chatbot-based scheduling to reduce waiting time and streamline appointment bookings.
SkinLab’s commitment to holistic care extends beyond treatment sessions, promoting skin health literacy educational content and workshops with doctors from sister brand SL Aesthetic Clinic.
“This award is a valuable milestone that reflects how far SkinLab The Medical Spa has grown as a brand,” says Dr Chua. “From the very start, our brand was designed with the customer at the centre, and that principle continues to guide every treatment developed and every experience delivered moving forward. The brand remains committed to advancing medical-led facial treatments that address a wide range of skin concerns more effectively.”
Looking ahead, SkinLab The Medical Spa remains committed to advancing its medical-led approach to skin health, continuing to explore and adopt clinically validated technologies to deliver more individualised care while reinforcing its commitment to clinical excellence across all its outlets.
To learn more, visit: www.skinlabmedspa.com
Hashtag: #SkinLabTheMedicalSpa #SLAestheticGroup #SingaporeRetailersAssociation
The issuer is solely responsible for the content of this announcement.
About SkinLab The Medical Spa
SkinLab The Medical Spa brings together the attentive, understated service of a world-class spa with medically grounded aesthetic science. As the dedicated medical spa brand of SL Aesthetic Group, SkinLab focuses on non-invasive facial treatments for acne, pigmentation, sensitive skin, and overall skin rejuvenation, delivering evidence-based care that supports long-term skin health.
Founded in the 2000s, SL Aesthetic Group is a healthcare and aesthetics group specialising in skin and hair health, women’s wellness, and holistic medicine. Its portfolio includes SL Aesthetic Clinic, a doctor-led medical aesthetics practice; SkinLab The Medical Spa; TrichoLab, a specialist hair and scalp centre; PROLOGUE, a women’s wellness and lifestyle medical clinic; and Euphie Skin Solutions in Malaysia. Across its network of clinics and outlets, the Group offers a comprehensive range of FDA-approved aesthetic and medical treatments, all supervised by trained and certified healthcare professionals holding Certificates of Competency (COC) recognised by the Aesthetic Practice Oversight Committee (APOC).
SkinLab The Medical Spa operates 10 locations across Singapore, including its flagship medical spa at Wheelock Place, while SL Aesthetic Group has a network of more than 20 clinics and outlets across Singapore and Malaysia.
The launch ceremony was attended by Mr. Do Quang Thai, First Secretary of the Embassy of the Socialist Republic of Vietnam in the Kingdom of Denmark, together with representatives from leading Danish organizations, including 3F, Dansk Erhverv, DPT and Carnegie Investment Bank, alongside strategic partners and industry stakeholders from the transport, technology, energy, finance and infrastructure sectors.
As one of the world’s leading cities in sustainable urban mobility, Copenhagen was chosen as Green SM’s first European market. Here, the company aims to complement the city’s existing transport network by offering another reliable, fully electric mobility option for residents and visitors alike.
In Denmark, the company operates a fully electric fleet of VinFast VF 6 and VF 8 vehicles, serving a wide range of everyday urban travel needs. Unlike many ride-hailing platforms that primarily connect passengers with independent drivers, Green SM directly owns and manages its fleet and oversees driver operations to help ensure consistent service quality and customer experience. During the initial phase of operations, Green SM will focus on establishing a reliable local operation, ensuring full compliance with Danish regulations, and continuously improving its service based on feedback from customers, drivers, and other stakeholders.
Delivering a safe, professional, and consistent customer experience begins with Green SM’s drivers. Before serving customers, every driver completes comprehensive training in road safety, customer service, operating procedures, and electric vehicle operation. Together with ongoing training and a robust local operations system, this helps ensure every journey reflects the high standards Green SM is committed to delivering.
Customers can book rides through the Green SM app, available on the App Store and Google Play. Fares are displayed before each trip is confirmed, and electronic receipts are issued automatically at the end of every journey. To mark its launch in Copenhagen, Green SM is offering new customers five (5) vouchers worth 25% off each trip, up to a maximum discount of 100 DKK per ride throughout the Grand Launch period from July 30 to September 30, 2026.
Richard Nabil Chahine, CEO of Green SM Europe, said: “Cities shape the future of mobility long before companies do. Copenhagen is one of those cities. That is why beginning our European journey here carries special meaning for Green SM. We come with deep respect for the standards already established here, drawing on what we have learned from serving millions of journeys across Asia. Our ambition is simple: to become a trusted mobility partner by delivering safe, professional and fully electric journeys that people can rely on every day. If we earn that trust, growth will naturally follow.”
Green SM’s expansion into Europe reflects the company’s long-term approach to international growth. Rather than prioritising rapid expansion, Green SM focuses on building well-structured local operations, adapting its services to local market needs, and earning trust through consistently reliable service.
With its fully electric fleet and low-emission operating model, Green SM hopes to contribute to Denmark’s long-standing ambitions for more sustainable mobility while providing another practical transport choice for everyday journeys.
Founded in Vietnam in 2023, Green SM currently operates in Vietnam, Laos, Indonesia, the Philippines, India and Kazakhstan. Through its fully electric fleet, technology platform and consistent operating standards, the company is steadily expanding internationally while adapting its services to local market needs.
Hashtag: #GreenSM
The issuer is solely responsible for the content of this announcement.
The collaboration marks a significant moment for Taiwan’s international media presence, as the completion of Gaudí’s vision draws global attention to one of the world’s most visited cultural landmarks. NHK has documented the construction of the Sagrada Família for decades, building a relationship of trust with the basilica’s team that enabled joint coverage.
TVBS crews filmed in areas rarely accessible to media, including the crypt where Gaudí is buried, architectural workshops, and key structural sections of the basilica. The team conducted interviews with architects and experts involved in the project during preparations for the inauguration ceremony. Construction on the church began in 1882, one year before Gaudí took over as chief architect.
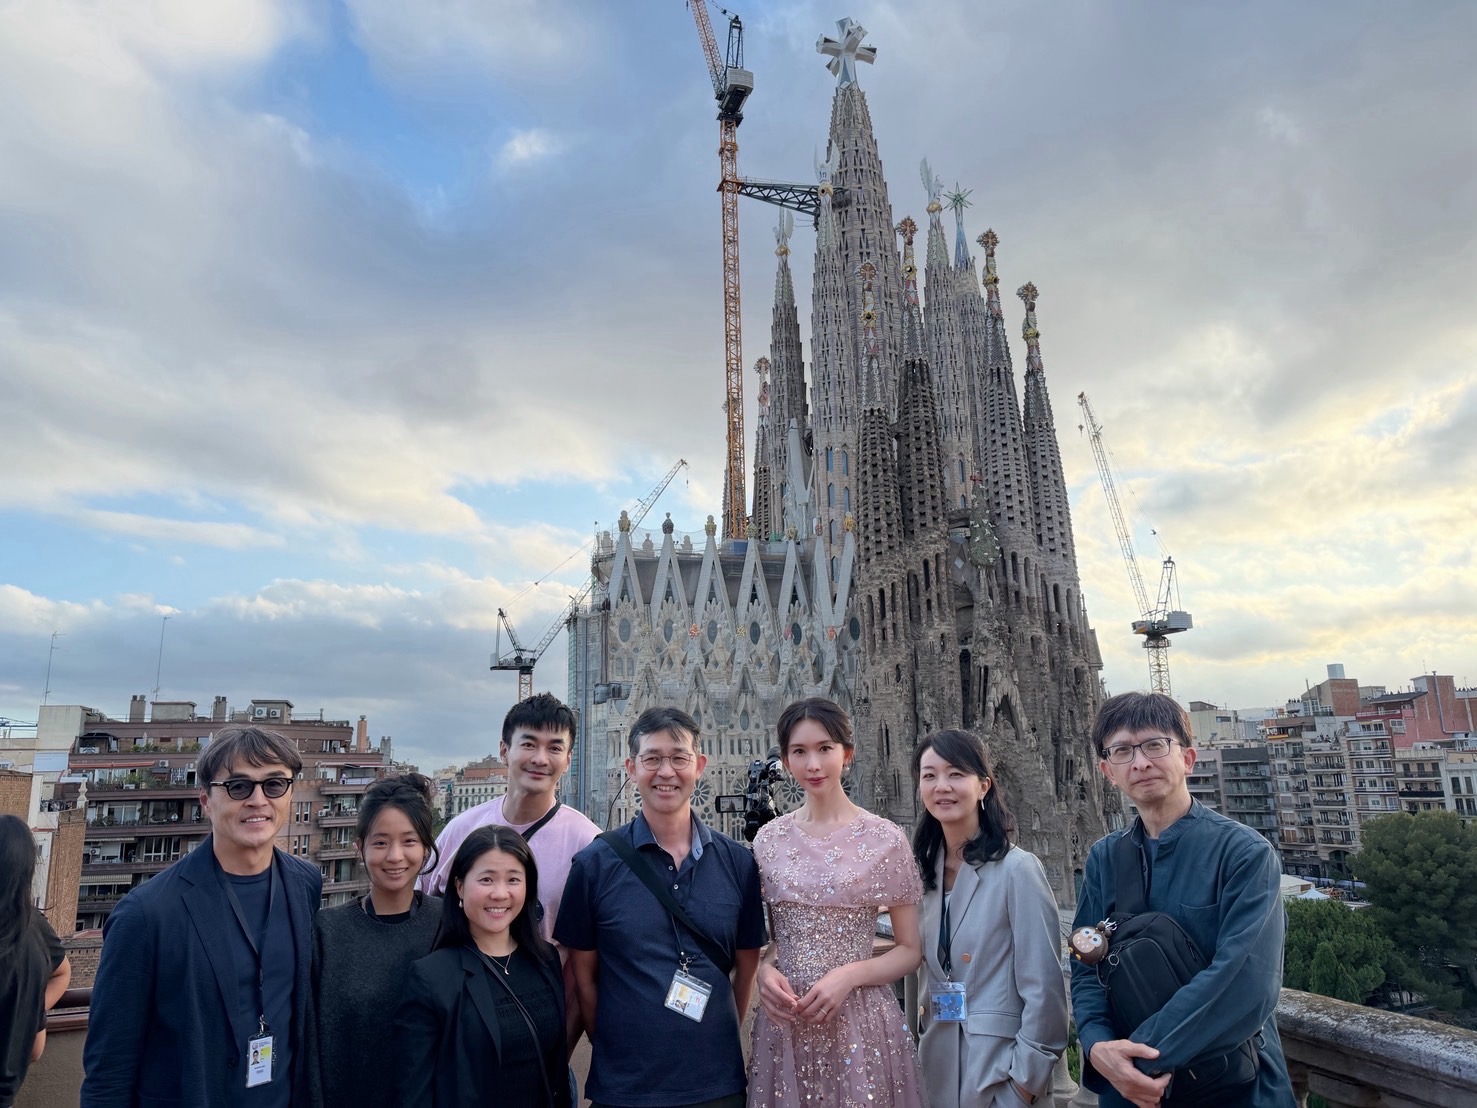
Taiwanese actress Lin Chi-ling joined the reporting team in Barcelona as a cultural ambassador for the project. Lin met with architects and experts to explore the basilica through the perspectives of architecture, aesthetics, and cultural heritage. Her involvement added a cultural dimension to the coverage beyond conventional architectural reporting.
The coverage brought together partners from Taiwan’s technology and financial sectors. HTC, through its VIVE Arts initiative, contributed its immersive experience “Gaudí, the Atelier of the Divine.” The virtual reality program allows audiences to explore Gaudí’s architectural world in new ways, transcending geographical and physical boundaries.
TS Financial Holding Co., Ltd., which has long supported arts and cultural exchange, sponsored the live broadcast. The company cited values of integrity, innovation, and sustainability in joining the project. The cross-sector collaboration extended Taiwan’s cultural advocacy onto the international stage, connecting the 144-year architectural endeavor to audiences in Taiwan and Chinese-speaking communities worldwide.
TVBS integrated AI-powered real-time translation technology throughout the live coverage, facilitating multilingual communication across international production teams. The project showcased Taiwan’s ability to connect industries and communities across borders. TVBS, NHK, HTC, and TS Financial Holding Co., Ltd., together documented a defining milestone in the Sagrada Família’s history.
Hashtag: #TVBS
The issuer is solely responsible for the content of this announcement.
