Economy
Entertainment as Payments Stress-Test: What High-Volume Microtransactions Teach Nigerian Fintechs

Nigeria’s payment rails are being shaped in places many bankers rarely look. Music livestreams, casual games, creator tips, and fan tokens create dense bursts of tiny transactions that look chaotic at first glance yet are ideal for testing scale, speed, and reliability. When a live event or a tournament peaks, thousands of payments try to clear at once. That is exactly when systems reveal their true limits.
For Nigerian fintechs (which are not always satisfactory), entertainment offers a natural lab where volumes are high, values are small, and user tolerance for friction is low. The lessons are very practical: Reduce steps, cut latency, and design for retries that do not double charge.
Why slots-led crypto play became the template for frictionless micro-payments
The best way to see how entertainment pushed payment design forward is to look at online games which are a significant part of modern entertainment. Now, digital gaming is massive, but one particular category (and we’re talking about online gambling games) includes probably the most amount of payments and transactions.
Today’s slot games live on a rhythm of quick spins and small stakes, so they need payments that feel invisible. A player tops up a wallet, scans a QR code, or approves a push request, and credit lands almost at once. Because games refresh results every few seconds, payment confirmation has to keep pace. Operators solve this with clear balances, instant authorisations against pre-funded value, and near-real-time settlement. The experience is simple, predictable, and always on.
Online Bitcoin slots stand out within crypto games for two practical reasons. First is scale. Slots attract broad, casual audiences that play in short sessions, which creates heavy streams of tiny transactions. Second is repeatability. Every spin has the same shape, so systems can optimize for the same call pattern again and again. That repeatable flow makes it easier to tune idempotency keys, queue priorities, and timeouts without confusing users.
The design choices that emerged here in digital casino games are now widely copied. Wallet connections avoid forms. QR prompts cut typing errors. Clear balance indicators remove doubt about what has been paid and what remains. Fast receipts build trust for the next spin or tip. Because settlement is digital wallet to digital wallet, there is less breakage, fewer hops, and fewer points of failure. The lesson for any Nigerian fintech working with microtransactions is straightforward. Keep the path short, show state clearly, and make each payment feel as fast as a screen tap. Do that, and you meet user expectations shaped by slots, streams, and other always-on entertainment.
What entertainment volumes reveal about Nigeria’s payments stack
High-volume streams of tiny payments expose weak links in seconds. That is why entertainment data is so useful for Nigerian providers planning peak loads, instant reversals, and real-time risk checks.ALT: Taylor Swift during a concert.

Taylor Swift’s Eras Tour presale in November 2022 turned into a payments flashpoint. Millions tried to buy at once, the site queued and crashed, and many customers saw failed checkouts and authorization holds before Ticketmaster cancelled the general on-sale. Image: Here
The country’s rails are ready for this kind of tempo. Real-time payments already account for a growing share of digital transactions, and overall e-payments have hit record value. At the same time, mobile reach is wide, which helps front-end reliability at the moments that matter most.
| Metric | Nigeria figure | Period |
| Instant money transfers completed | Over 12 billion | 2024 |
| Share of all transactions that were real-time | 27.7 percent | 2023 |
| Forecast share of transactions that will be real-time | 50.1 percent | 2028 |
| Total e-payment value | N1.07 quadrillion | 2024 |
| Active telecom subscriptions | 169.3 million | July 2025 |
| Broadband penetration | 48 percent | July 2025 |
Data is taken from the following sources: NIBSS, ACI Worldwide, Telecom Review Africa
For builders, these numbers translate into clear tasks. Plan for short spikes that mimic a popular stream or in-game tournament. Use asynchronous confirmation with clear on-screen states so users keep playing while the ledger finalises. Design retries and reconciliation around idempotency to avoid duplicates during bursts. Split risk checks so most payments clear in milliseconds, while a small fraction routes to deeper review without blocking the rest. Finally, treat receipts as a product. Users will keep paying when receipts are instant, readable, and stored.
Design cues fintechs can borrow from always-on entertainment
The reliability bar in entertainment is high because the session is the product. If a payment screen feels heavy, the user leaves. Nigeria’s real-time growth shows that consumers already expect taps to turn into balances almost at once, and providers are racing to match that feel across use cases. It is worth noting that smartphone access still shapes what is possible, so lightweight, data-thrifty flows help close the gap and grow volumes. As the GSMA puts it, “Handset affordability is often recognised as the most significant barrier to get people online.” That single constraint makes clean, low-bandwidth payment screens a competitive edge.
Two practical patterns stand out. First, event-driven architecture. Queue every request, give each one a unique key, and make the UI reflect real states like pending, paid, or refunded. This removes confusion during spikes and prevents user double taps from creating duplicates. Second, graceful degradation. When network conditions dip, fall back to cached balances, offer a timed retry, and display a short countdown that reassures the user. These small touches came from entertainment because sessions cannot pause.
The macro trends support this direction. Real-time’s share of transactions in Nigeria is set to rise strongly through 2028, and overall e-payment value is already at historic highs. That momentum encourages merchants to accept more tiny payments, which in turn rewards providers that can clear thousands of them in a few seconds without noise or errors. Entertainment has shown the path. Build for speed that users can feel, and make every confirmation instant and obvious.


Most traders evaluate a strategy by looking at its historical performance.
Common metrics such as total return, win rate, profit factor, maximum drawdown, and Sharpe ratio provide valuable information about how a strategy performed in the past.
The problem is that historical performance tells only one story.
Financial markets are inherently uncertain. Even a strategy with an impressive backtest can experience very different outcomes once it encounters changing market conditions, unexpected volatility, or an unfavorable sequence of trades.
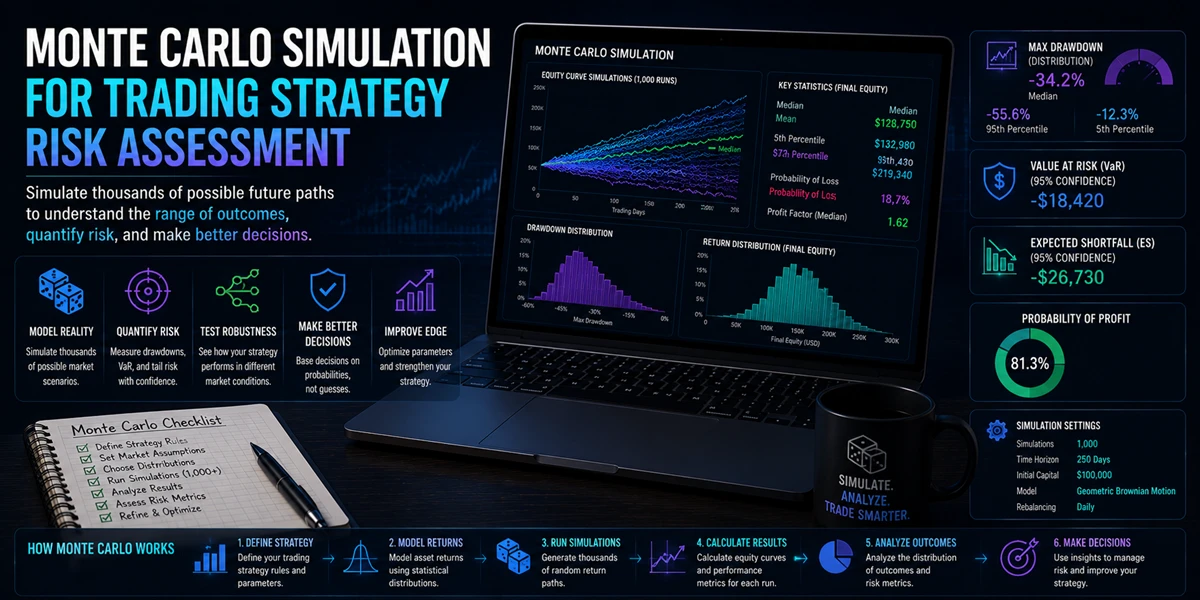
This is why professional traders, quantitative researchers, and portfolio managers increasingly rely on Monte Carlo simulation as part of their risk assessment process.
Rather than focusing on a single historical outcome, Monte Carlo analysis explores thousands of possible scenarios, helping traders understand what could happen—not just what already happened.
Why Historical Performance Is Only Part Of The Picture
Backtesting remains one of the most important tools in strategy development.
Platforms such as MetaTrader 5 provide sophisticated testing environments that allow traders to evaluate Expert Advisors and trading systems using historical market data.
A typical backtest may show:
| Metric | Result |
|---|---|
| Net Profit | 35% |
| Win Rate | 54% |
| Maximum Drawdown | 12% |
At first glance, these numbers appear encouraging.
However, every backtest contains one important limitation:
History occurred only once.
The strategy followed a specific sequence of winning and losing trades. If those same trades had occurred in a different order, the overall experience could have looked very different.
This is where Monte Carlo analysis becomes valuable.
Understanding Sequence Risk
One of the most important concepts in Monte Carlo simulation is sequence risk.
Consider a simple series of trades:
| Trade | Result |
|---|---|
| 1 | +3% |
| 2 | +2% |
| 3 | -1% |
| 4 | +4% |
| 5 | -2% |
The overall result is positive.
However, if those same trades occurred in a different order:
| Trade | Result |
|---|---|
| 1 | -2% |
| 2 | -1% |
| 3 | +2% |
| 4 | +3% |
| 5 | +4% |
the final return may remain similar while the path becomes significantly more difficult.
The trader may experience:
- Larger drawdowns
- Longer recovery periods
- Increased psychological pressure
- Greater capital requirements
The strategy itself has not changed.
Only the sequence has changed.
Monte Carlo simulation explores thousands of these alternative scenarios to estimate how different trade sequences may influence future performance.
Exploring Thousands Of Possible Outcomes
Monte Carlo analysis works by generating large numbers of alternative outcomes based on historical strategy behavior.
A simplified process looks like this:
Historical Trade Results
        ↓
    Randomization
        ↓
     Simulation
        ↓
Repeat Thousands of Times
        ↓
    Risk Analysis
Each simulation represents a plausible alternative version of history.
By repeating this process thousands of times, traders can estimate:
- Potential drawdowns
- Losing streak probabilities
- Capital requirements
- Performance variability
- Confidence intervals
The objective is not to predict the future.
The objective is to understand uncertainty.
Looking Beyond Average Returns
Many traders focus heavily on expected returns.
Risk professionals often focus on worst-case outcomes.
Consider two strategies:
| Metric | Strategy A | Strategy B |
|---|---|---|
| Average Return | 20% | 20% |
| Historical Drawdown | 10% | 10% |
At first glance, they appear nearly identical.
Monte Carlo analysis may reveal a different story:
| Risk Metric | Strategy A | Strategy B |
|---|---|---|
| Worst Simulated Drawdown | 18% | 35% |
| Probability of 20% Drawdown | 5% | 27% |
Although historical results appear similar, future risk characteristics may differ significantly.
This is one reason why institutional investors rarely rely solely on traditional backtest statistics.
The Reality Of Losing Streaks
One of the most underestimated aspects of trading is the impact of consecutive losses.
Even profitable strategies can experience difficult periods.
For example:
| Consecutive Trades |
|---|
| Loss |
| Loss |
| Loss |
| Loss |
| Loss |
| Loss |
Such sequences are completely normal.
However, they often create emotional pressure and lead traders to abandon otherwise profitable systems.
Monte Carlo analysis helps estimate:
- Expected losing streak lengths
- Worst-case losing streaks
- Probability of extended downturns
- Recovery requirements
Understanding these possibilities allows traders to set more realistic expectations before real capital is exposed.
Position Sizing And Capital Preservation
Position sizing is one of the most important applications of Monte Carlo analysis.
Even profitable strategies can fail if risk per trade is too aggressive.
Monte Carlo simulations help answer questions such as:
- How much capital is required?
- What position size is sustainable?
- What drawdown level is acceptable?
- What is the probability of account depletion?
For example, a strategy may appear relatively safe at 1% risk per trade.
The same strategy may exhibit a significant probability of severe drawdowns when risk increases to 5% per trade.
Understanding these relationships often leads to better risk-management decisions.
Portfolio Risk And Diversification
Monte Carlo simulation is not limited to individual strategies.
Portfolio managers frequently use it to evaluate:
- Multi-strategy portfolios
- Multi-asset portfolios
- Diversification effects
- Correlation risks
A portfolio may appear well diversified based on historical data.
However, asset relationships can change unexpectedly during periods of market stress.
Monte Carlo analysis helps traders evaluate how portfolios may behave under alternative scenarios rather than relying solely on historical observations.
Randomness Plays A Bigger Role Than Most Traders Realize
One of the most important lessons of Monte Carlo analysis is that randomness influences results more than many traders expect.
A profitable strategy can experience:
- Unfavorable timing
- Extended drawdowns
- Long losing streaks
- Temporary underperformance
without any deterioration in the underlying strategy.
Understanding this distinction helps traders separate:
| Normal Statistical Variation | Genuine Strategy Problems |
|---|---|
| Temporary drawdowns | Structural performance decline |
| Random losing streaks | Broken trading logic |
| Short-term underperformance | Changing market assumptions |
This perspective is essential for long-term strategy management.
Monte Carlo As Part Of A Complete Validation Process
Monte Carlo analysis works best when combined with other research methods.
Many professional workflows follow a process similar to:
| Step | Process |
|---|---|
| 1 | Strategy Development |
| 2 | Historical Backtesting |
| 3 | Optimization |
| 4 | Monte Carlo Analysis |
| 5 | Forward Testing |
| 6 | Deployment |
| 7 | Ongoing Monitoring |
The broader MetaTrader ecosystem supports many stages of this workflow through strategy testing, optimization, algorithmic development, and performance analysis tools.
The objective is not simply to find profitable strategies.
The objective is to understand how those strategies may behave when market conditions become less favorable.
Why Professional Firms Use Monte Carlo Analysis
Institutional investment firms focus on risk as much as return.
Their goal is not only to identify profitable opportunities but also to understand:
- Capital requirements
- Worst-case scenarios
- Portfolio resilience
- Survival probabilities
These considerations become increasingly important as capital allocations grow larger.
The same principles can benefit independent traders.
A strategy with slightly lower returns but substantially lower risk may ultimately prove more sustainable over the long term.
Understanding Risk Beyond The Backtest
Historical performance provides valuable information, but it tells only part of the story.
Monte Carlo simulation helps traders explore the uncertainty that exists beyond a single backtest result. By generating thousands of alternative scenarios, the technique provides insight into drawdowns, losing streaks, capital requirements, and portfolio resilience.
As algorithmic trading becomes increasingly sophisticated, risk assessment is becoming just as important as strategy development itself.
The most successful traders are often not those who find the highest returns.
They are those who understand the risks behind those returns and prepare for outcomes that may never appear in a traditional backtest.
In modern quantitative trading, understanding uncertainty can be just as valuable as identifying opportunity.

By Adedapo Adesanya
Nigeria attracted $10.37 billion in capital importation in the first quarter of 2026, representing an 83.8 per cent increase from the $5.64 billion recorded in the corresponding period of 2025, according to the National Bureau of Statistics (NBS).
The latest Capital Importation Report released by the stats bureau also showed that capital inflows rose by 60.97 per cent from $6.44 billion recorded in the fourth quarter of 2025.
The report stated, “In Q1 2026, total capital importation into Nigeria stood at $10.37bn, higher than $5.64bn recorded in Q1 2025, indicating an increase of 83.83 per cent. In comparison to the preceding quarter, capital importation increased by 60.97 per cent from $6.44bn in Q4 2025.”
Analysis of the inflows showed that portfolio investment remained the dominant source of foreign capital, accounting for $9.86 billion or 95.09 per cent of the total amount imported into the economy.
The stats office disclosed that foreign direct investment stood at $135.08 million, representing only 1.30 per cent of total capital inflows, while other investments accounted for $374.48 million or 3.61 per cent.
“Portfolio Investment ranked top with $9.86bn, accounting for 95.09 per cent, followed by Other Investment with $374.48m, accounting for 3.61 per cent. Foreign Direct Investment recorded the least with $135.08m, representing 1.30 per cent of total capital importation in Q1 2026,” the report added.
A further breakdown showed that money market instruments attracted the largest share of portfolio investments at $6.50 billion, while investments in bonds amounted to $3.23 billion.
Equity investments under the portfolio category stood at $131.81 million.
The banking sector emerged as the biggest destination for foreign capital during the quarter, attracting $7.55 billion, representing 72.79 per cent of total inflows.
The financing sector followed with $2.43 billion or 23.42 per cent, while the production and manufacturing sector attracted $152.27 million, accounting for 1.47 per cent of total capital imported.
Other sectors that received foreign investments included shares, trading, agriculture, information technology services, telecommunications, oil and gas, transport, construction, healthcare, education, and consultancy services.
The United Kingdom remained Nigeria’s largest source of foreign capital, accounting for $5.08 billion or 49.01 per cent of total inflows. The United States followed with $3.18 billion, representing 30.69 per cent, while South Africa accounted for $983.83 million or 9.49 per cent.
Among financial institutions, Standard Chartered Bank Nigeria Limited received the highest capital inflow during the quarter at $4.41 billion, representing 42.56 per cent of the total.
Stanbic IBTC Bank Plc followed with $2.78 billion or 26.79 per cent, while Rand Merchant Bank handled $930.82 million, accounting for 8.97 per cent.
Other banks that facilitated capital inflows into the country during the period included Citibank Nigeria, Access Bank, First Bank of Nigeria, Guaranty Trust Bank, Zenith Bank, FCMB, Ecobank, Fidelity Bank, and United Bank for Africa.

By Aduragbemi Omiyale
The 2026 licensing round for oil fields is expected to commence in the third quarter of 2026, the Nigerian Upstream Petroleum Regulatory Commission (NUPRC) has disclosed.
This followed the approval of President Bola Tinubu, who doubles as the Minister of Petroleum Resources.
A statement issued by the spokesperson of NUPRC, Mr Eniola Akinkuotu, on Wednesday said the authorisation is in compliance with the Petroleum Industry Act (PIA).
“We are also fortunate that the President and Minister of Petroleum Resources has approved the 2026 Licensing Round,” the chief executive of the agency, Mrs Oritsemeyiwa Eyesa, was quoted as saying in the statement when she received representatives of Meren Energy (formerly Africa Oil) in Abuja yesterday.
Mrs Eyesan, who expressed satisfaction with the conduct of the 2025 Licensing Round so far, stated that the commercial bid would take place in July, after which the next licensing round would commence.
The NUPRC boss said the heightened participation in the 2025 Licensing Round was a testament to the fact that Nigeria was headed in the right direction.
She said the rise in investments, coupled with the upswing in production, was evidence that Nigeria’s oil and gas sector, under the leadership of President Bola Tinubu, had become attractive.
“We are in the process of finalising the 2026 launch, which will happen by the third quarter at the latest. So, this is the make-or-break point, and we want to make sure we make it,” she stated.
In his remarks, the chief executive of Meren Energy, Mr Oliver Quinn, said the current reforms had inspired the company to increase its investments in Nigeria, hence its interest in asset divestments and licensing rounds, revealing that his company’s investment priority is Africa, of which Nigeria ranks as number one.
“We have operated in Agbami, Akpo and Egina world-class fields. I think till date, in 20 years, about $11bn in capital from our side has gone into these assets, and about $4bn has gone to tax and royalties,” he said, adding, “Nigeria remains the core of our business today because of the quality of these assets.”
According to Mr Quinn, Meren Energy is pressuring its partners on these assets to deepen their investments and then increase overall production, noting that the energy firm was the first in Nigeria to sell crude oil to the Dangote refinery and will continue to fulfil its Domestic Crude Supply Obligation so long as the price remains right.
-
 Feature/OPED6 years ago
Davos was Different this year
-
Travel/Tourism10 years ago
Lagos Seals Western Lodge Hotel In Ikorodu
-

 Showbiz3 years ago
Estranged Lover Releases Videos of Empress Njamah Bathing
-
 Banking8 years ago
Sort Codes of GTBank Branches in Nigeria
-

 Economy3 years ago
Subsidy Removal: CNG at N130 Per Litre Cheaper Than Petrol—IPMAN
-

 Banking3 years ago
Sort Codes of UBA Branches in Nigeria
-

 Banking3 years ago
First Bank Announces Planned Downtime
-

 Sports3 years ago
Highest Paid Nigerian Footballer – How Much Do Nigerian Footballers Earn