Brands/Products
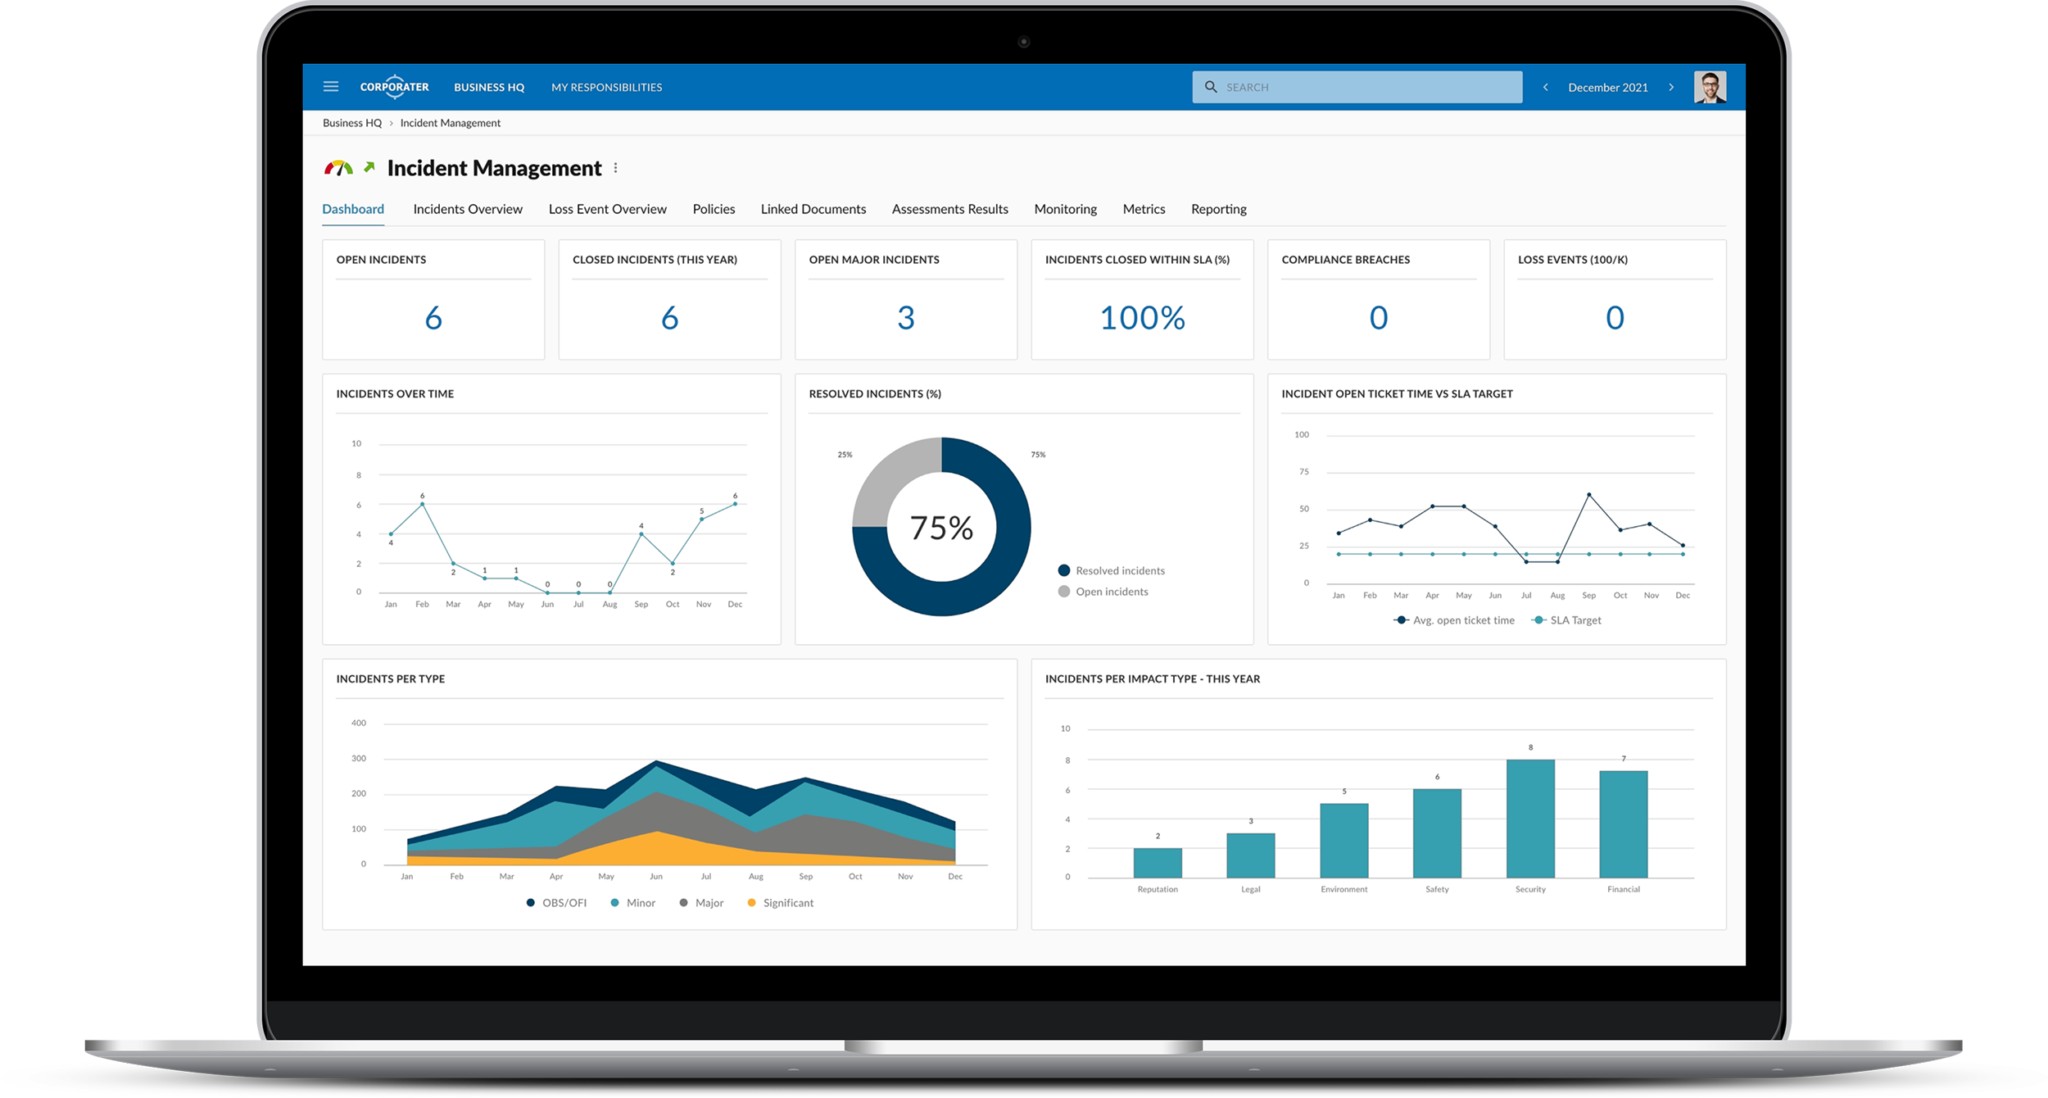
Why Automated Dashboard is Falling Short in PR Measurement
By Philip Odiakose
Public relations is an integral part of any organization’s communication strategy. It involves creating and maintaining a positive image of the brand in the minds of the target audience. PR professionals use various tactics, such as media relations, influencer marketing, and content creation, to achieve their goals.
However, measuring and evaluating the effectiveness of these tactics is crucial to understanding the return on objective (ROO) and making data-driven decisions.
In recent years, many PR professionals have turned to automated dashboards to measure and analyze their PR metrics. While these dashboards offer a level of convenience, they are falling short in PR measurement. In this article, I will explore why automated dashboards are not the silver bullet for PR measurement.
- Lack of Customization
One of the major drawbacks of automated dashboards is the lack of customization. These dashboards are designed to be a one-size-fits-all solution, which means that they may not capture all the metrics that are relevant to a particular PR campaign or engagement.
For instance, if a company is running a campaign to increase its media presence, the automated dashboard may not track all the relevant metrics, making it difficult to gauge the campaign’s success accurately. Automated dashboards may also not take into account the specific goals and objectives of the PR campaign, resulting in incomplete data and inaccurate results.
- Inability to Measure the Quality of Coverage
Automated dashboards are designed to measure the quantity of media coverage, such as the number of mentions, shares, or likes. However, they are unable to measure the quality of the coverage. Quality metrics, such as tone, message penetration, and audience reach, are essential for PR professionals to determine the effectiveness of their campaigns.
Automated dashboards may miss crucial quality metrics that could impact the PR campaign’s success. For example, a high number of media mentions may seem positive, but if the tone of the coverage is negative, it could harm the brand’s image and reputation.
- Lack of Human Analysis
Automated dashboards rely on algorithms to analyze data, which may not always produce accurate results. There are certain nuances and context-specific factors that can only be identified by human analysis. For example, a spike in media coverage for a particular brand could be due to negative news coverage, which an automated dashboard may not be able to differentiate from positive coverage.
Human analysis is necessary to understand the context and nuances of PR measurement accurately. Automated dashboards may also miss out on important trends and patterns that require a human touch to identify and analyze.
- Inability to Integrate with Other Data Sources
PR measurement is not just about measuring media coverage. It requires integration with other data sources, such as web analytics, sales data, and customer feedback. Automated dashboards may not be able to integrate with all these sources, making it difficult for PR professionals to get a holistic view of the campaign’s effectiveness.
For instance, if a PR campaign is designed to increase sales, the automated dashboard may not be able to connect the media coverage to the actual sales figures, leading to incomplete data and inaccurate results.
- Lack of Actionable Insights
Automated dashboards provide a lot of data, but they may not provide actionable insights. PR professionals need insights to make data-driven decisions and improve their campaigns. Automated dashboards may not provide insights that are specific to the campaign’s objectives, making it difficult to improve and optimize the campaign.
PR professionals need insights that can help them identify what is working and what is not and make adjustments accordingly. Automated dashboards may not be able to provide such insights, resulting in incomplete data and inaccurate results.
In conclusion, automated dashboards may offer a level of convenience in PR measurement, but they are falling short of providing accurate, comprehensive, and actionable insights.
PR professionals should opt for Media Intelligence Consultants that provide human analysis and measure both the quantity and quality of media coverage. Such solutions can help PR professionals make data-driven decisions and improve their campaigns’ effectiveness.
Philip Odiakose is the Chief Insights Consultant at P+ Measurement Services, a Media Intelligence Consultancy in Lagos state, Nigeria.


By Adedapo Adesanya
Canal+, which now owns MultiChoice, a pay-TV firm, has announced its decision to discontinue the streaming service, Showmax.
The company said the Showmax board has made the decision to discontinue the service in the near future.
“This decision reflects our focus on strengthening our overall digital offering and ensuring long-term sustainability in an increasingly competitive streaming environment.
“Importantly, at the moment, there will be no interruption to your current service. You can continue streaming as usual, and no action is required from you at this time,” it said.
It added that it will share further details in the future, including timelines and any future steps, should they be required.
MultiChoice launched Showmax across Africa 10 years ago in August 2015 to compete with the advent of streamers like Netflix, Apple TV, Amazon’s Prime Video, Disney+ and others, which all became available on the continent and started biting into MultiChoice’s legacy pay-TV subscriber base on DStv and GOtv.
However, it soon faced some challenges and couldn’t hit its target.
In February 2024, MultiChoice, in partnership with Comcast’s NBCUniversal, relaunched Showmax, utilising the technology behind the Peacock streaming service.
The investment, which was pegged at over $300 million, still did not bear the expected fruit, with other streaming giants seeing growth over the years.
With Canal+’s takeover and its aggressive cost-cutting moves, it was no doubt that Showmax got the axe.
Regardless, it said, “Streaming remains central to our strategy. We will continue to invest in premium content, technology innovation and partnerships to deliver the best possible entertainment experience to our customers.”
Canal+ is looking to cut a combined €400 million by 2030, which will affect content.
NBCUniversal has a 30 per cent stake in Showmax as a joint venture. In its last annual results before the Canal+ takeover, MultiChoice revealed that Showmax’s trading losses had worsened by 88 per cent while revenue significantly declined.
According to the company, “The decision to axe Showmax was made by the Showmax board and reflects the continued focus of MultiChoice, a Canal+ company, on financial discipline and investment optimisation, in an increasingly competitive and capital-intensive global streaming environment.”
Since Canal+, as part of its agreement to take over MultiChoice, isn’t allowed to get rid of any staff for a period of three years, MultiChoice won’t let any Showmax staff go but will reassign them to other positions within the broader company.
MultiChoice has already started to quietly rebrand Showmax Originals as Africa Magic, M-Net, kykNET and Mzansi Magic Originals, with original series that will transition to these various DStv linear TV channels on the MultiChoice pay-TV platform.
Showmax’s closure comes two years after Amazon MGM Studios shocked Nigeria and South Africa’s creative community in January 2024 when it announced that it would stop commissioning any new local original content in Africa, and also ended already-existing development deals with a dozen production companies.
By Modupe Gbadeyanka
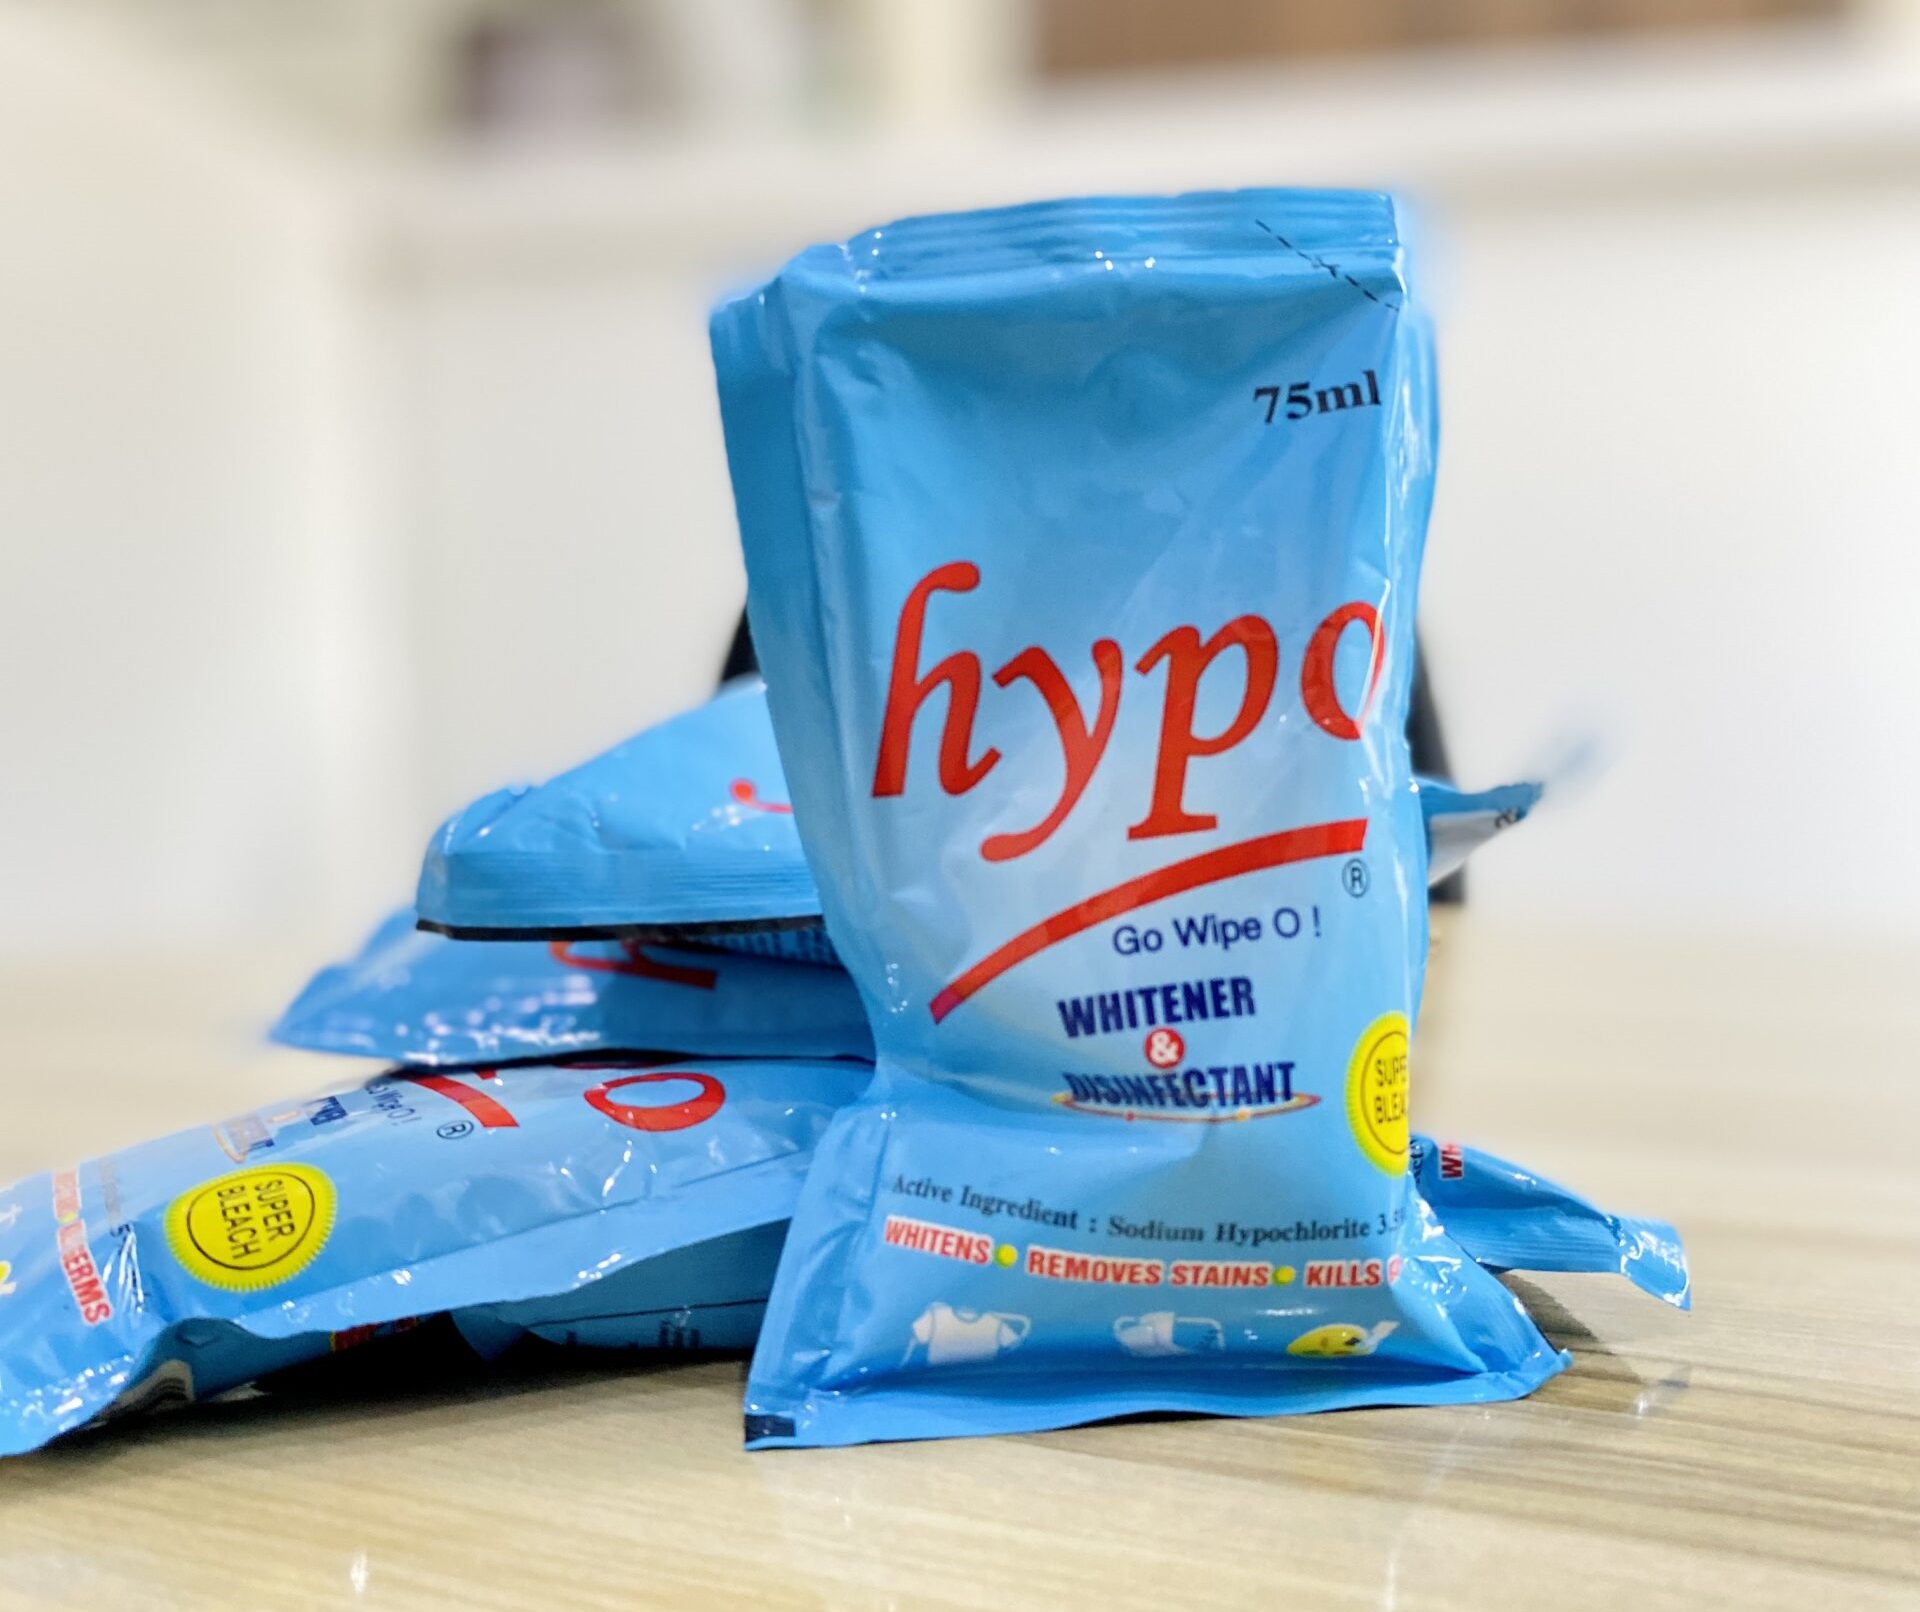
The Marketing Manager of a leading bleach brand in Nigeria, Hypo Bleach, Mr Adebayo Adeyemo, has condemned the presentation of the brand as a beverage for trends, jokes, or views by influencers and bloggers.
In a statement, Mr Adeyemo said Hypo Bleach was formulated to “remove stains, whiten your white fabric, deodorise and kill 99.9 per cent of germs” and not produced as a “drink.”
“We have observed people seeming to have fun creating and sharing videos and AI-generated images designed to make Hypo look like a beverage.
“Your health and safety are serious business. We want to be unambiguous: those images are fabricated, that framing is false, and anyone encouraging others to consume Hypo, even as a joke, even for views, is putting lives at risk. It is not something to consume for the sake of trends,” the Marketing Manager stated.
He further said, “To every influencer, blogger, and content creator. Your reach is real; so is your responsibility. A trend that ends in ill-health is not a trend worth starting.”
“To every young Nigerian seeing this content, you do not have to prove anything to anyone. Not online. Not offline. Not ever. If someone is pressuring you to try this, that is not a dare. That is harm.
|If you or someone you know is struggling emotionally or feeling pressure they cannot handle, please reach out to someone you trust.
A guardian. A counsellor. A healthcare professional. Asking for help is not a weakness; it is a strength.
“Also, we urge people to prioritise their mental health. Evaluate the quality of your conversations with people. Should you notice inconsistencies in their thinking, encourage them to seek professional help. Depression is real and should be treated with utmost concern. Let’s keep social media fun, but safe,” Mr Adeyemo added.
By Dipo Olowookere
A conference designed to examine how Artificial Intelligence (AI) is fundamentally reshaping crisis communication, institutional response systems, governance frameworks, and reputational risk management is slated to take place on Wednesday, March 25, 2026, in Lagos, at 10 am.
The event, planned by a renowned Public Relations (PR) firm, CMC Connect LLP, is themed Crisis Management in the AI Milieu: New Threats, Smarter Responses.
It is an offshoot of the company’s flagship industry initiative, Crisis Management Advocacy Month, scheduled to be held throughout March 2026.
The Minister of Communications, Innovation and Digital Economy, Mr Bosun Tijani, is expected to deliver the keynote address, while the Minister of Information and National Orientation, Mr Mohammed Idris Malagi, is the Special Guest of Honour.
Earlier in the month, the Vice President for Corporate Communications and CSR at Airtel Africa, Mr Emeka Oparah, will headline a closed-door media workshop convened exclusively for senior media executives in Lagos.
The 2026 edition will also feature strategic collaborations with the Nigerian Institute of Public Relations (NIPR) through its Monthly PR Clinics in both the Lagos and Abuja Chapters, where the Senior Corporate Communications Analyst at CMC Connect LLP, Ms Affiong Edet, will deliver a thematic presentation aligned with this year’s focus.
The initiative will also partner with the Nigerian Bar Association Section on Legal Practice through its weekly webinar series to interrogate the intersection of AI, Crisis Management, and the Law.
“Artificial Intelligence has fundamentally altered the crisis landscape. Crisis Management Advocacy Month 2026 is intentionally designed to convene cross-sector leaders to interrogate emerging risks, strengthen institutional preparedness, and promote smarter, ethical response architectures in an AI-driven environment,” the Project Coordinator, Ms Bright Emmanuel Okon, commented.
Also, the Lead Partner of CMC Connect LLP, Mr Yomi Badejo-Okunsanya, said, “In today’s digital ecosystem, crises evolve at unprecedented speed. Institutions must move beyond reactive communication toward intelligent crisis architecture. Crisis Management Advocacy Month represents our commitment to advancing national and institutional resilience in the age of AI.”


-
 Feature/OPED6 years ago
Davos was Different this year
-
Travel/Tourism10 years ago
Lagos Seals Western Lodge Hotel In Ikorodu
-

 Showbiz3 years ago
Estranged Lover Releases Videos of Empress Njamah Bathing
-
 Banking8 years ago
Sort Codes of GTBank Branches in Nigeria
-

 Economy3 years ago
Subsidy Removal: CNG at N130 Per Litre Cheaper Than Petrol—IPMAN
-

 Banking3 years ago
Sort Codes of UBA Branches in Nigeria
-

 Banking3 years ago
First Bank Announces Planned Downtime
-

 Sports3 years ago
Highest Paid Nigerian Footballer – How Much Do Nigerian Footballers Earn