
Economy
Asian Shares Close Lower as Trade Worries Persist

By Investors Hub
Asian stocks ended mostly lower on Monday as trade worries persisted, oil prices declined on supply worries, Chinese manufacturing data came in softer than expected and a resolution to Germany’s government crisis proved elusive.
Crude oil prices fell more than 1 percent in Asian trading after U.S. President Donald Trump claimed that Saudi Arabia has agreed to raise oil production.
China’s Shanghai Composite Index tumbled 71.65 points or 2.5 percent to 2,775.77 after surveys showed a deterioration in the outlook for Chinese manufacturing, adding to concerns over tighter government controls on lending. Hong Kong markets were closed for the SAR Day holiday.
Japanese shares hit 2-1/2-month lows as the dollar pared back gains against the yen ahead of a July 6th deadline when the United States is due to impose tariffs on Chinese exports. A slump in China’s stock market and weak data on manufacturer sentiment also forced investors to unwind long positions.
An index monitoring business sentiment in Japan ebbed in the second quarter of 2018, the Bank of Japan said in its quarterly Tankan business survey. The large manufacturers’ index came in with a score of +21, missing expectations for +22 and down from +24 in the previous quarter.
Separately, a Nikkei survey showed that activity in Japan’s manufacturing sector continued to expand in June, and at an accelerated rate.
The Nikkei 225 Index plunged 492.58 points or 2.2 percent to 21,811.93, marking the largest single-day loss since mid-March and the lowest closing level since April 13th. The broader Topix Index plummeted 2.1 percent to close at 1,695.29.
Defensive stocks came under selling pressure, with Kikkoman Corp. and Aeon falling around 6 percent. Sharp Corp. shares fell 7.8 percent on profit taking after moving sharply higher last Friday.
Australian shares fell modestly as investors digested mixed data on consumer inflation, manufacturing and job advertisements and looked ahead to Reserve Bank of Australia?s monetary policy decision on Tuesday.
The benchmark S&P/ASX 200 Index dropped 16.80 points or 0.3 percent to 6,177.80. The broader All Ordinaries Index ended down 16.40 points or 0.3 percent at 6,273.30.
While healthcare stocks rebounded after six straight sessions of losses, banking and realty stocks succumbed to selling pressure.
Automotive Holdings Group plunged 8.8 percent after China’s HNA Group pulled out of a A$280 million deal to buy its refrigerated logistics business.
By Adedapo Adesanya
The Nigerian Upstream Petroleum Regulatory Commission (NUPRC) will, at the Commercial Bid Conference, announce the successful bidders for 50 oil and gas blocks in the 2025 Licensing Round on July 21, 2026.
The regulator said the conference would conclude an eight-month licence round that began on December 1, 2025, after President Bola Tinubu approved the exercise under the Petroleum Industry Act (PIA) 2021.
The commission said the 50 blocks include 15 onshore, 19 shallow-water, 15 frontier and one deep-offshore block, covering basins such as the Niger Delta, Chad Basin, Benue Trough, Anambra and Bida.
It said the round aims to attract about $10 billion in fresh investment and to unlock discovered but undeveloped fields, fallow assets and gas resources. NUPRC described the 2025 round as the third licensing exercise under the PIA framework and stressed it is designed to prioritise natural gas development.
NUPRC outlined a five-stage process for the round — registration and pre-qualification, data acquisition, technical bid submission and evaluation, and the commercial bid conference — followed by ministerial approval and contracting. The Commission said it notified pre-qualified applicants on March 16, 2026, and closed technical and commercial bids on June 12, 2026.
NUPRC chief executive, Mrs Oritsemeyiwa Eyesan, had said the selection would be merit-based and would exclude weaker applicants.
She said only candidates with strong technical and financial credentials, professionalism and credible development plans would advance, and that winners would be chosen on a weighted combination of technical and commercial scores.
To widen participation, the federal government fixed signature bonuses for the round in a prescribed range of $3 million to $7 million per block, the Commission said, adding that bids outside that range would be non-compliant and excluded.
NUPRC said it would resolve the tied highest bids within the range by conducting a sealed rebid for the signature bonus, adding that successful bidders will receive Petroleum Prospecting Licences (PPLs) and may elect either a Concession or a Production Sharing Contract (PSC) framework, noting that the choice of framework will determine fiscal terms for up to two decades.
The agency noted that bidders were required to present host community development plans and to commit to remit 3 per cent of operating expenditure to Host Community Development Trusts. It said decarbonisation objectives and broader environmental, social and governance (ESG) requirements were mandatory parts of submissions.
It warned that applicants with government debts, those that had previously failed to develop licences “vigorously and in a business-like manner,” or those found non-compliant with applicable laws could be disqualified at any stage.
The regulator said it expects ministerial approval and formal contracting between July and October 2026, after which awardees must execute concession contracts before licences take legal effect.
Recall that during the 25th Nigeria Oil and Gas (NOG) Energy Week in Abuja, the NUPRC issued PPLs to 12 companies across 19 blocks from the 2024 round. The Commission named recipients, including Boron Energy Limited, Energy Marketing and Supply Limited, Sahara Deepwater Resources Limited, Tulkan Energy E&P Company Limited and said that the exercise showed the licensing pipeline was functioning.
By Adedapo Adesanya
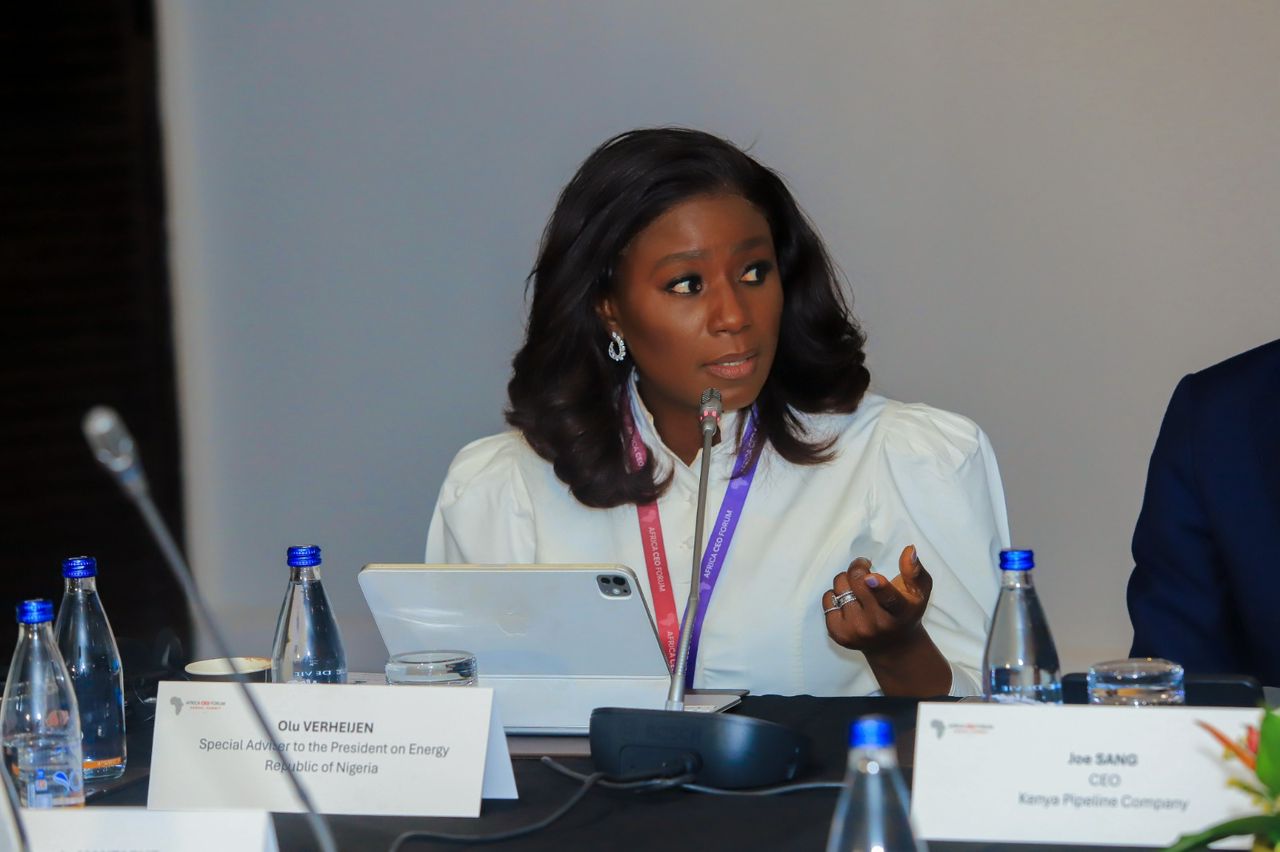
The Special Adviser to the President on Energy, Mrs Olu Verheijen, has said Nigeria requires about $38.3 billion in fresh investment to sustain current oil and gas production and achieve its 2030 output targets.
Speaking at the recently concluded 25th NOG Energy Week Conference and Exhibition in Abuja, Mrs Verheijen said global investors are now prioritising countries with predictable policies, competitive fiscal terms and credible regulatory systems.
“For Africa, that question is urgent. And for Nigeria, the scale of the task is equally clear: to sustain the current base and grow toward our 2030 production target, analysis shows a financing gap of about $38.3 billion,” she said.
According to her, the era when countries relied solely on resource endowment to attract capital has ended.
“Capital has no passport. It is rational. It prices risk. It follows credibility. It asks one question: can this country turn resources into bankable projects, and bankable projects into reliable returns?”
She said Nigeria had deliberately repositioned itself through reforms aimed at improving investor confidence and accelerating project execution.
“We recalibrated fiscal terms, clarified regulation and streamlined oversight. We introduced targeted incentives and cut contracting timelines by more than half. We made a clear statement to the world: Nigeria is no longer asking to be trusted; Nigeria is working to be bankable.”
Highlighting progress recorded under the reforms, Verheijen said Nigeria now has more than $50 billion worth of upstream projects in its visible investment pipeline.
“We now have more than 50 billion dollars of upstream projects in the visible pipeline. In the last three years, more than 10 billion dollars of long-awaited final investment decisions have come through.”
She added that crude oil and condensate production has increased by about 400,000 barrels per day since 2023, while onshore production is at its highest level in two decades.
“Crude oil and condensate production has risen by about 400,000 barrels per day since 2023. Onshore production is at its strongest level in twenty years.”
Mrs Verheijen said the Federal Government remains committed to achieving its target of producing three million barrels of oil per day and 10 billion standard cubic feet of gas daily by 2030, while strengthening Nigeria’s competitiveness in the global energy market.
She also highlighted ongoing reforms in the power sector, including the N4 trillion Presidential Power Sector Financial Reforms Programme, which she described as critical to restoring confidence across Nigeria’s electricity value chain.
On gas development, she said the government was expanding domestic LPG supply, improving affordability and supporting investments through tax and import duty incentives.
“A gas-rich nation cannot be comfortable when families are priced back to firewood, charcoal or kerosene,” she said.
Mrs Verheijen stressed that Nigeria’s ambition extends beyond exporting crude oil to building an industrial economy anchored on value addition.
“We have chosen not merely to produce molecules, but to convert molecules into megawatts, fertiliser, petrochemicals, mobility, manufacturing, jobs and exports.”
She concluded that the country’s reforms were laying the foundation for long-term growth despite lingering challenges.
“The age of Nigerian hesitation is ending. The age of Nigerian ambition has begun. Our task now is to turn reform into relief, capital into projects, projects into jobs, and energy into national greatness.”
By Adedapo Adesanya
Nigeria’s headline inflation rate in June 2026 moderated to 15.91 per cent from 15.93 per cent in May, as pressure from the Iran war mildly eased, though it largely remained in focus during the review month.
In the report on Wednesday, the statistical office showed that the headline inflation rate for June on a month-on-month basis was 1.66 per cent, 0.09 per cent lower than the 1.75 per cent recorded in May 2026.
On an annualised basis, the print was down from 25.29 per cent in the same month of the preceding year (June 2025). This was due to the rebasing of the calculation year from 2009 to 2024.
The rise in prices, which stemmed from the continued conflict in the Middle East, continued to stoke food prices and energy costs, which account for a huge chunk of average spending.
The food inflation rate in May 2026 on a month-on-month basis was 3.75 per cent, up by 0.77 percentage points from May 2026 (2.98 per cent), while on a year-on-year basis, it was 17.52 per cent and stood at 25.41 per cent in the same month of the preceding year (June 2025).
At 15.91 per cent print, the inflation marginally beat expectations by Meristem Research, predicted at 15.95 per cent.
There had been expectations that the ceasefire between the United States and Iran would help drive oil prices lower, raising expectations of some relief on the inflation front. However, with conflicts now flaring up again, oil prices are likely to increase again, and the anticipated easing in energy-driven inflation may not materialise as broadly as earlier envisaged.
Meristem Research said it expects inflationary pressures to re-emerge across key economies in the near term, as the re-escalation of the US-Iran conflict has reignited upward pressure on global oil prices.
This will be a core factor that the Monetary Policy Committee (MPC) of the Central Bank of Nigeria (CBN) will be looking at when it meets for the next policy meeting. At its last meeting, the committee left benchmarked interest rates at 26.5 per cent.
