
Economy
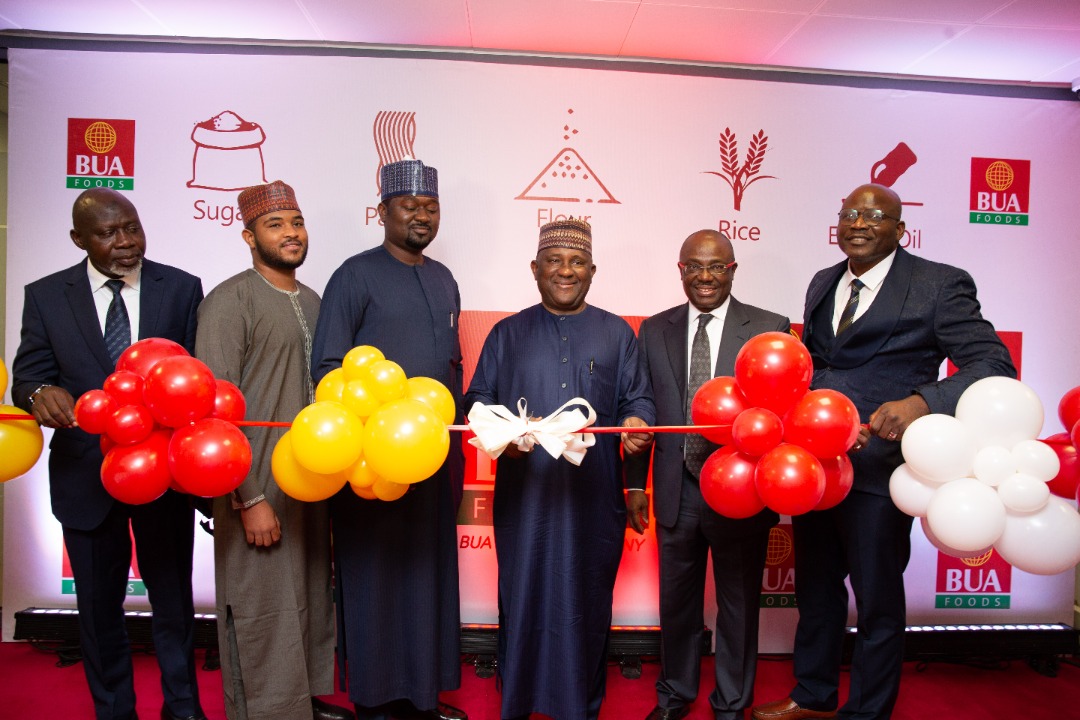
BUA Foods Raises Dividend by 29% After Price Adjustment to Soak High Costs
By Dipo Olowookere
Shareholders of BUA Foods Plc will receive a higher cash reward for the 2022 financial year because the board of the organisation has proposed a higher dividend for the reporting year.
BUA Foods recently released its financial statements for 2022, and a dividend of N4.50 was declared, higher than the N3.50 paid to investors in the 2021 fiscal year by about 29 per cent.
This occurred after the company recorded a 38 per cent improvement in its profit before tax at N107.2 billion in the year under review compared with the N77.5 billion reported a year earlier, as the net profit grew by 31 per cent to N91.3 billion from the N69.8 billion posted in 2021, and the Earning Per Share (EPS) grew by 20 per cent to N5.07 from N4.24.
It was observed that despite the economic headwinds that characterised the year, especially due to the unending disruption of the business climate with high input costs and currency devaluation, BUA Foods reported an improvement in its gross earnings, majorly due to adjustments to the prices of the products.
Business Post reports that revenue grew by 26 per cent to N418.3 billion in FY 2022 from N333.2 billion 12 months earlier as a result of growth posted by its business lines, sugar, flour, and pasta.
The sugar segment of the business contributed 66 per cent to revenue in FY 2022, higher than the 64 per cent contribution in 2021, with revenue of N275.1 billion versus N209 billion in FY 2021.
This was driven by price adjustments and export sales within the period despite a decline in production due to energy disruptions.
As for the flour division, its contribution rose from 16 per cent to 20.6 per cent last year at N69.4 billion versus N85.9 billion, respectively. Price adjustments in the accounting year buoyed the growth despite a fall in the volume sold in the year.
However, the contribution of the pasta arm of BUA Foods to the revenue generated by the firm went down to 14 per cent from 20 per cent amid an 18 per cent drop in production volume to 111,578 tons from 136,859 tons as a result of energy challenges in the second quarter of the year.
According to the financial statements, increases in energy and raw materials costs pushed the cost of sales higher by 24 per cent in FY 2022 to N285.6 billion from N230.3 billion. The company said it was affected by the high input cost environment and further devaluation of the Naira against the US Dollar, which weighed heavily on prices for raw materials and aggravated the cost of production.
However, this did not suppress the gross profit, which rose by 29 per cent to N132.8 billion from N103 billion because the firm passed this cost to the consumers as it hiked the prices of its products.
Also, despite the 28 per cent jump in administrative expenses due to the increase in general expenses, and a 33 per cent leap in total operating expenses in the year, BUA Foods closed December 31, 2022, with an operating profit of N117.5 billion compared to N79.8 billion achieved in 2021.
Commenting on the performance of the organisation, the Managing Director of BUA Foods, Mr Ayodele Abioye, said, “BUA Foods Plc continued to maintain her leading position as the most profitable Foods and FMCG listed company in Nigeria with PBT of N107.2 billion, a growth of 38 per cent in the prior year.
“This is despite the unending disruption of the business climate with high input costs and currency devaluation resulting in increased operational costs.
“We remain resolute to navigate the numerous business headwinds to continue delivering double-digit growth with a sustained focus on our market expansion strategy across our business segments.
“Delivering long-term values to all our stakeholders as we continue to nourish lives remains cardinal.”
By Adedapo Adesanya
The Nigerian Upstream Petroleum Regulatory Commission (NUPRC) will, at the Commercial Bid Conference, announce the successful bidders for 50 oil and gas blocks in the 2025 Licensing Round on July 21, 2026.
The regulator said the conference would conclude an eight-month licence round that began on December 1, 2025, after President Bola Tinubu approved the exercise under the Petroleum Industry Act (PIA) 2021.
The commission said the 50 blocks include 15 onshore, 19 shallow-water, 15 frontier and one deep-offshore block, covering basins such as the Niger Delta, Chad Basin, Benue Trough, Anambra and Bida.
It said the round aims to attract about $10 billion in fresh investment and to unlock discovered but undeveloped fields, fallow assets and gas resources. NUPRC described the 2025 round as the third licensing exercise under the PIA framework and stressed it is designed to prioritise natural gas development.
NUPRC outlined a five-stage process for the round — registration and pre-qualification, data acquisition, technical bid submission and evaluation, and the commercial bid conference — followed by ministerial approval and contracting. The Commission said it notified pre-qualified applicants on March 16, 2026, and closed technical and commercial bids on June 12, 2026.
NUPRC chief executive, Mrs Oritsemeyiwa Eyesan, had said the selection would be merit-based and would exclude weaker applicants.
She said only candidates with strong technical and financial credentials, professionalism and credible development plans would advance, and that winners would be chosen on a weighted combination of technical and commercial scores.
To widen participation, the federal government fixed signature bonuses for the round in a prescribed range of $3 million to $7 million per block, the Commission said, adding that bids outside that range would be non-compliant and excluded.
NUPRC said it would resolve the tied highest bids within the range by conducting a sealed rebid for the signature bonus, adding that successful bidders will receive Petroleum Prospecting Licences (PPLs) and may elect either a Concession or a Production Sharing Contract (PSC) framework, noting that the choice of framework will determine fiscal terms for up to two decades.
The agency noted that bidders were required to present host community development plans and to commit to remit 3 per cent of operating expenditure to Host Community Development Trusts. It said decarbonisation objectives and broader environmental, social and governance (ESG) requirements were mandatory parts of submissions.
It warned that applicants with government debts, those that had previously failed to develop licences “vigorously and in a business-like manner,” or those found non-compliant with applicable laws could be disqualified at any stage.
The regulator said it expects ministerial approval and formal contracting between July and October 2026, after which awardees must execute concession contracts before licences take legal effect.
Recall that during the 25th Nigeria Oil and Gas (NOG) Energy Week in Abuja, the NUPRC issued PPLs to 12 companies across 19 blocks from the 2024 round. The Commission named recipients, including Boron Energy Limited, Energy Marketing and Supply Limited, Sahara Deepwater Resources Limited, Tulkan Energy E&P Company Limited and said that the exercise showed the licensing pipeline was functioning.

By Adedapo Adesanya
The Special Adviser to the President on Energy, Mrs Olu Verheijen, has said Nigeria requires about $38.3 billion in fresh investment to sustain current oil and gas production and achieve its 2030 output targets.
Speaking at the recently concluded 25th NOG Energy Week Conference and Exhibition in Abuja, Mrs Verheijen said global investors are now prioritising countries with predictable policies, competitive fiscal terms and credible regulatory systems.
“For Africa, that question is urgent. And for Nigeria, the scale of the task is equally clear: to sustain the current base and grow toward our 2030 production target, analysis shows a financing gap of about $38.3 billion,” she said.
According to her, the era when countries relied solely on resource endowment to attract capital has ended.
“Capital has no passport. It is rational. It prices risk. It follows credibility. It asks one question: can this country turn resources into bankable projects, and bankable projects into reliable returns?”
She said Nigeria had deliberately repositioned itself through reforms aimed at improving investor confidence and accelerating project execution.
“We recalibrated fiscal terms, clarified regulation and streamlined oversight. We introduced targeted incentives and cut contracting timelines by more than half. We made a clear statement to the world: Nigeria is no longer asking to be trusted; Nigeria is working to be bankable.”
Highlighting progress recorded under the reforms, Verheijen said Nigeria now has more than $50 billion worth of upstream projects in its visible investment pipeline.
“We now have more than 50 billion dollars of upstream projects in the visible pipeline. In the last three years, more than 10 billion dollars of long-awaited final investment decisions have come through.”
She added that crude oil and condensate production has increased by about 400,000 barrels per day since 2023, while onshore production is at its highest level in two decades.
“Crude oil and condensate production has risen by about 400,000 barrels per day since 2023. Onshore production is at its strongest level in twenty years.”
Mrs Verheijen said the Federal Government remains committed to achieving its target of producing three million barrels of oil per day and 10 billion standard cubic feet of gas daily by 2030, while strengthening Nigeria’s competitiveness in the global energy market.
She also highlighted ongoing reforms in the power sector, including the N4 trillion Presidential Power Sector Financial Reforms Programme, which she described as critical to restoring confidence across Nigeria’s electricity value chain.
On gas development, she said the government was expanding domestic LPG supply, improving affordability and supporting investments through tax and import duty incentives.
“A gas-rich nation cannot be comfortable when families are priced back to firewood, charcoal or kerosene,” she said.
Mrs Verheijen stressed that Nigeria’s ambition extends beyond exporting crude oil to building an industrial economy anchored on value addition.
“We have chosen not merely to produce molecules, but to convert molecules into megawatts, fertiliser, petrochemicals, mobility, manufacturing, jobs and exports.”
She concluded that the country’s reforms were laying the foundation for long-term growth despite lingering challenges.
“The age of Nigerian hesitation is ending. The age of Nigerian ambition has begun. Our task now is to turn reform into relief, capital into projects, projects into jobs, and energy into national greatness.”
By Adedapo Adesanya
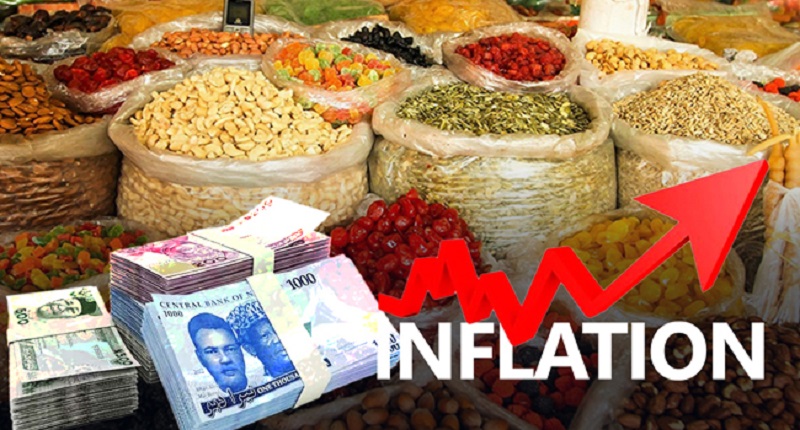
Nigeria’s headline inflation rate in June 2026 moderated to 15.91 per cent from 15.93 per cent in May, as pressure from the Iran war mildly eased, though it largely remained in focus during the review month.
In the report on Wednesday, the statistical office showed that the headline inflation rate for June on a month-on-month basis was 1.66 per cent, 0.09 per cent lower than the 1.75 per cent recorded in May 2026.
On an annualised basis, the print was down from 25.29 per cent in the same month of the preceding year (June 2025). This was due to the rebasing of the calculation year from 2009 to 2024.
The rise in prices, which stemmed from the continued conflict in the Middle East, continued to stoke food prices and energy costs, which account for a huge chunk of average spending.
The food inflation rate in May 2026 on a month-on-month basis was 3.75 per cent, up by 0.77 percentage points from May 2026 (2.98 per cent), while on a year-on-year basis, it was 17.52 per cent and stood at 25.41 per cent in the same month of the preceding year (June 2025).
At 15.91 per cent print, the inflation marginally beat expectations by Meristem Research, predicted at 15.95 per cent.
There had been expectations that the ceasefire between the United States and Iran would help drive oil prices lower, raising expectations of some relief on the inflation front. However, with conflicts now flaring up again, oil prices are likely to increase again, and the anticipated easing in energy-driven inflation may not materialise as broadly as earlier envisaged.
Meristem Research said it expects inflationary pressures to re-emerge across key economies in the near term, as the re-escalation of the US-Iran conflict has reignited upward pressure on global oil prices.
This will be a core factor that the Monetary Policy Committee (MPC) of the Central Bank of Nigeria (CBN) will be looking at when it meets for the next policy meeting. At its last meeting, the committee left benchmarked interest rates at 26.5 per cent.
