
Economy
Okomu Oil: Great Finish to Epic Year
By ARM Securities
Over FY 16, The Okomu Oil Palm Company Plc (Okomu) reported a nearly two-fold YoY jump in earnings buoyed by an upsurge in commodity prices (CPO and rubber) and the company’s focus on containing cost.
In view of the buoyant operating performance, the company raised its dividend per share to N1.50 (FY 15: N0.10) yet still had sufficient capital to pursue its expansion plans.
Going forward, the still favourable price regime as well as management’s cost containment efforts leave scope for sustained earnings growth over 2017.
Okomu reported its fastest pace of revenue growth in five years as favourable pricing environment drove sales at the Crude Palm Oil (CPO) segment to record high even as rubber turnover recovered from the 2015 trough despite weaker volumes (-8% YoY to 7,140MT).
Pertinently, the robust CPO sales in the review period was buoyed by higher domestic CPO prices—which reflected combined impact of naira depreciation and bullish global CPO prices (+13% YoY) that deterred imports (29% of total supply).
At the other end, cartel like cuts by major rubber producers bolstered impact of weaker currency on rubber sales, which are entirely exported.
Management linked the decline in rubber volume to the combined impact of wind damage and fire outbreaks on some portion of the company’s rubber plantation which forced some rejuvenation exercises on a section of the company’s rubber farmland.
Given the price induced revenue growth, Okomu reported a moderate rise in input (+5% YoY) and operating (+22% YoY) costs despite rising energy expenses.
According to Management, the benign cost is a fall-out of deliberate increase in import substitution—with imported raw materials now reduced to about 10% of COGS—and tight control on labour costs (65% of overall cost).
Particularly, over the period, the company reduced its full-time employees by 5% to 534 with the knock-down effect applying downward pressure on salaries and wages (-4.4% YoY to N2.4 billion). Consequently, operating margin rose to a record high of 48% (operating profit: +112% YoY). Further down, despite FX loss of N1.0 billion1 which underpinned a nearly three-fold YoY jump in net finance cost, strong operating performance ensured a nearly two-fold YoY jump in earnings to a record high of N4.9 billion.
Over 2017, we expect revenue growth to be tempered by recent retracement in domestic CPO prices from January 2017 peak of N732/kg2 which management linked to the sharp appreciation of the naira (incentivising cheaper imports), declining demand, and onset of the harvest season.
Nonetheless, reflecting the lower base in 2016, we project mean CPO prices to be 38% higher YoY at N423/kg.
The foregoing combined with higher volume (+7% YoY to 38,853MT), informs our forecasted CPO sales to N16.7 billion (+37% YoY). With regards to rubber, management’s guidance of sustained rejuvenation exercise over the financial year underpins our flat volume projection of 7,140MT.
However, reflecting recovery in global rubber prices (Q1 17: +94% YoY, 2017E: +44% YoY), we project a 44% YoY jump in rubber sales to N3.2 billion which brings overall turnover to N19.8 billion (+38% YoY), sustaining its double-digit growth for the third consecutive year, albeit at a slower pace.
On costs, as with 2016, we expect both input and operating cost to rise modestly, given the largely price induced growth in top-line.
In addition, management intends to increasingly substitute its biggest remaining raw material import (fertiliser) with domestic alternatives if available, or cheaper imports. Furthermore, the company intends to connect to the national grid over the year, which could reduce power cost by as much as 60%.
Given that significant progress on this front is not expected until towards the end of the year, we believe the company’s expanded plantation of 21,798 hectares3 should drive a 10% and 21% YoY rise in COGS and OPEX respectively.
Given the company’s sizable external debt of N1.2 billion (43% of total borrowings), we expect vagaries in the FX rate, which we forecast at N360/$ at the year end to induce a N300 million FX loss (-72% YoY) with the reverberating effect expected to drive net finance cost 57% lower YoY to N451 million. Bringing it altogether, we project FY 17 earnings to climb 80% YoY to N8.8 billion.
Largely reflecting strong earnings growth thus far, Okomu has rallied 30.7% YTD, as with peer Presco (+17.2% YTD) outperforming the broader NSEASI (-6.2% YTD).
The stock trades at current P/E of 10.20x (forward: 5.6x) vs. 11.61x (forward: 8.46x) for Bloomberg Middle East & Africa peers with last trading price of N52.51 at a discount to our FVE of N63.10.
We maintain our BUY rating on the stock.
Source: www.armsecurities.com.ng.
All rights reserved. This publication or any portion thereof may not be reproduced or used in any manner whatsoever without the express written permission of ARM Securities Limited
By Adedapo Adesanya
The Central Securities Clearing System (CSCS) Plc has declared the first interim dividend in its history after posting its financial results for the first half of 2026, reflecting robust earnings growth, improved operating efficiency and stronger capital market activity.
The board approved an interim dividend of N1.00 per ordinary share for the six months ended June 30, 2026, citing the company’s strong cash generation, resilient balance sheet and confidence in the sustainability of its earnings.
The interim payout represents about 56 per cent of the total dividend of N1.78 per share paid for the 2025 financial year, underscoring its strong earnings momentum while preserving financial flexibility to invest in technology, innovation and future growth.
CSCS recorded one of the strongest financial performances in its history during the review period, with total operating income rising by 92 per cent to N18.51 billion from the corresponding period of 2025.
The growth was driven by higher transaction fee income as capital market activity strengthened, continued expansion in depository services, increased collateral management revenues and stronger contributions from data and technology-enabled services. Investment income also improved as the company optimised its investment portfolio.
Despite the sharp rise in revenue, operating expenses increased by only 38 per cent, reflecting disciplined cost management and the scalability of the company’s business model.
As a result, operating profit surged by 186 per cent to N10.11 billion, while profit before tax climbed by 115 per cent to N13.21 billion. Earnings per share also rose significantly to 190.1 kobo from 109.1 kobo in the corresponding period of 2025.
The organisation also recorded improvements in operating efficiency. Its cost-to-income ratio declined to 45.4 per cent from 63.2 per cent a year earlier, while operating profit margin improved to 54.6 per cent from 36.8 per cent.
According to the company, the results demonstrate not only the benefits of stronger market activity but also the resilience of its operating model and its ability to convert revenue growth into higher profitability, improved shareholder returns and sustainable long-term value creation.
Commenting on the interim dividend, the Chairman of CSCS Plc, Mr Temi Popoola, said the board’s decision reflected confidence in the firm’s financial strength, earnings quality and long-term strategic direction.
He said the strong performance was driven not only by increased market activity but also by sustained improvements in operational efficiency, disciplined cost management and the continued diversification of revenue streams.
Mr Popoola noted that the Board remained committed to balancing shareholder returns with investments in technology, innovation, resilience and new growth opportunities that would strengthen CSCS’ position as Nigeria’s leading financial market infrastructure and one of Africa’s foremost post-trade institutions.
The chief executive of CSCS Plc, Mr Shehu Yahaya Shantali, attributed the strong performance to the resilience of the entity’s business model, the dedication of its workforce and the confidence of market participants.
He said the first-ever interim dividend demonstrated the company’s ability to translate strong earnings growth and improved operating efficiency into enhanced shareholder value.
Mr Shantali added that CSCS would continue to strengthen its core market infrastructure, invest in technology and innovation, diversify its revenue base and enhance value creation for stakeholders while supporting the development of Nigeria’s capital market.

By Aduragbemi Omiyale
The national scale long-term issuer rating of Axxela Limited has been upgraded by GCR Rating to A+(NG), just as its short-term issuer rating was affirmed with a stable outlook.
The rating firm upgraded the long-term issue rating for Axxela Funding 1 Plc’s N16.4 billion series 1 senior unsecured bond to A+(NG), while the N11.5 billion series 1 senior secured bond was lifted to A+(NG)(EL).
GCR noted in a note that the actions reflect the leading gas and power portfolio company’s robust business model, strong earnings performance, and sustained financial profile, reinforcing its ability to deliver long-term value while maintaining financial discipline.
Axxela’s recent achievements have been driven by its continued focus on responsible growth, customer satisfaction, and creating lasting value for national development.
“The ratings upgrade by GCR is a strong endorsement of Axxela’s disciplined approach to business. Beyond recognising our financial strength, it reflects the resilience of our business model and the confidence in our strategic direction.
“Over the past few years, we have continued to make significant strides across the business by expanding our natural gas infrastructure, strengthening our operational footprint, advancing our sustainability agenda, and maintaining an unwavering commitment to operational excellence and safety,” the chief executive of Axxela, Mr Moshood Olajide, commented on the development.
As the company continues to advance its long-term growth strategy, the upgraded ratings reinforce confidence in Axxela’s credit profile, financial resilience, and ability to create enduring value for investors, customers and other stakeholders.
By Adedapo Adesanya
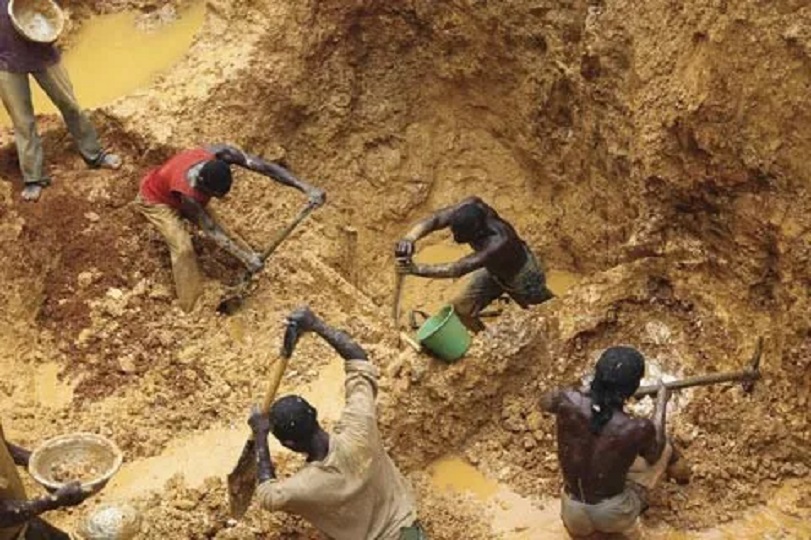
The Ministry of Solid Minerals Development and the National Identity Management Commission (NIMC) have strengthened their partnership to deploy digital identity technology, aiming to combat illegal mining and enhance security in Nigeria’s mining sector.
Speaking while receiving the Director-General and management of NIMC on a courtesy visit to his office in Abuja, the Minister of Solid Minerals Development, Mr Dele Alake, described the commission as a critical institution in Nigeria’s development architecture, stressing that effective governance could not be achieved without a credible identity management system.
“NIMC occupies a critical position in translating policy into reality. It is pivotal to the development of any nation because governance today is driven by data, technology and credible identity systems,” he added.
He noted that inadequate identification systems had weakened enforcement efforts over the years, allowing illegal mining activities to flourish in mineral-rich communities.
“Without identification, we cannot trace or track, and insecurity will flourish. In the solid minerals sector, we need effective monitoring of both legal and illegal operations.
“A credible identity ecosystem will strengthen regulation, improve enforcement and support our efforts to sanitise the sector,” Mr Alake said.
The minister identified technology, statistics, data gathering and digital identity as critical enablers for evidence-based policymaking, improved regulatory oversight, efficient licensing, investment promotion and national development.
On her part, the DG of NIMC, Mrs Abisoye Coker-Odusote, highlighted several opportunities for collaboration between both institutions, noting that the newly enacted NIMC Act has positioned Nigeria to fully embrace a digital governance ecosystem.
She explained that deeper integration of identity management into the solid minerals sector would facilitate database integration across government institutions, enhance regulatory compliance, strengthen security and law enforcement, improve monitoring of operators, and provide stronger support for the implementation of Community Development Agreements (CDAs) in mining host communities.
Mrs Coker-Odusote added that NIMC’s upgraded digital infrastructure is capable of supporting government institutions in building reliable databases, improving transparency and delivering more efficient public services.
Both institutions said they would immediately begin implementing technology-driven initiatives under the partnership, expressing confidence that expanding access to trusted digital identities for miners and other eligible residents would enhance accountability and strengthen governance in the solid minerals sector.
