
Economy
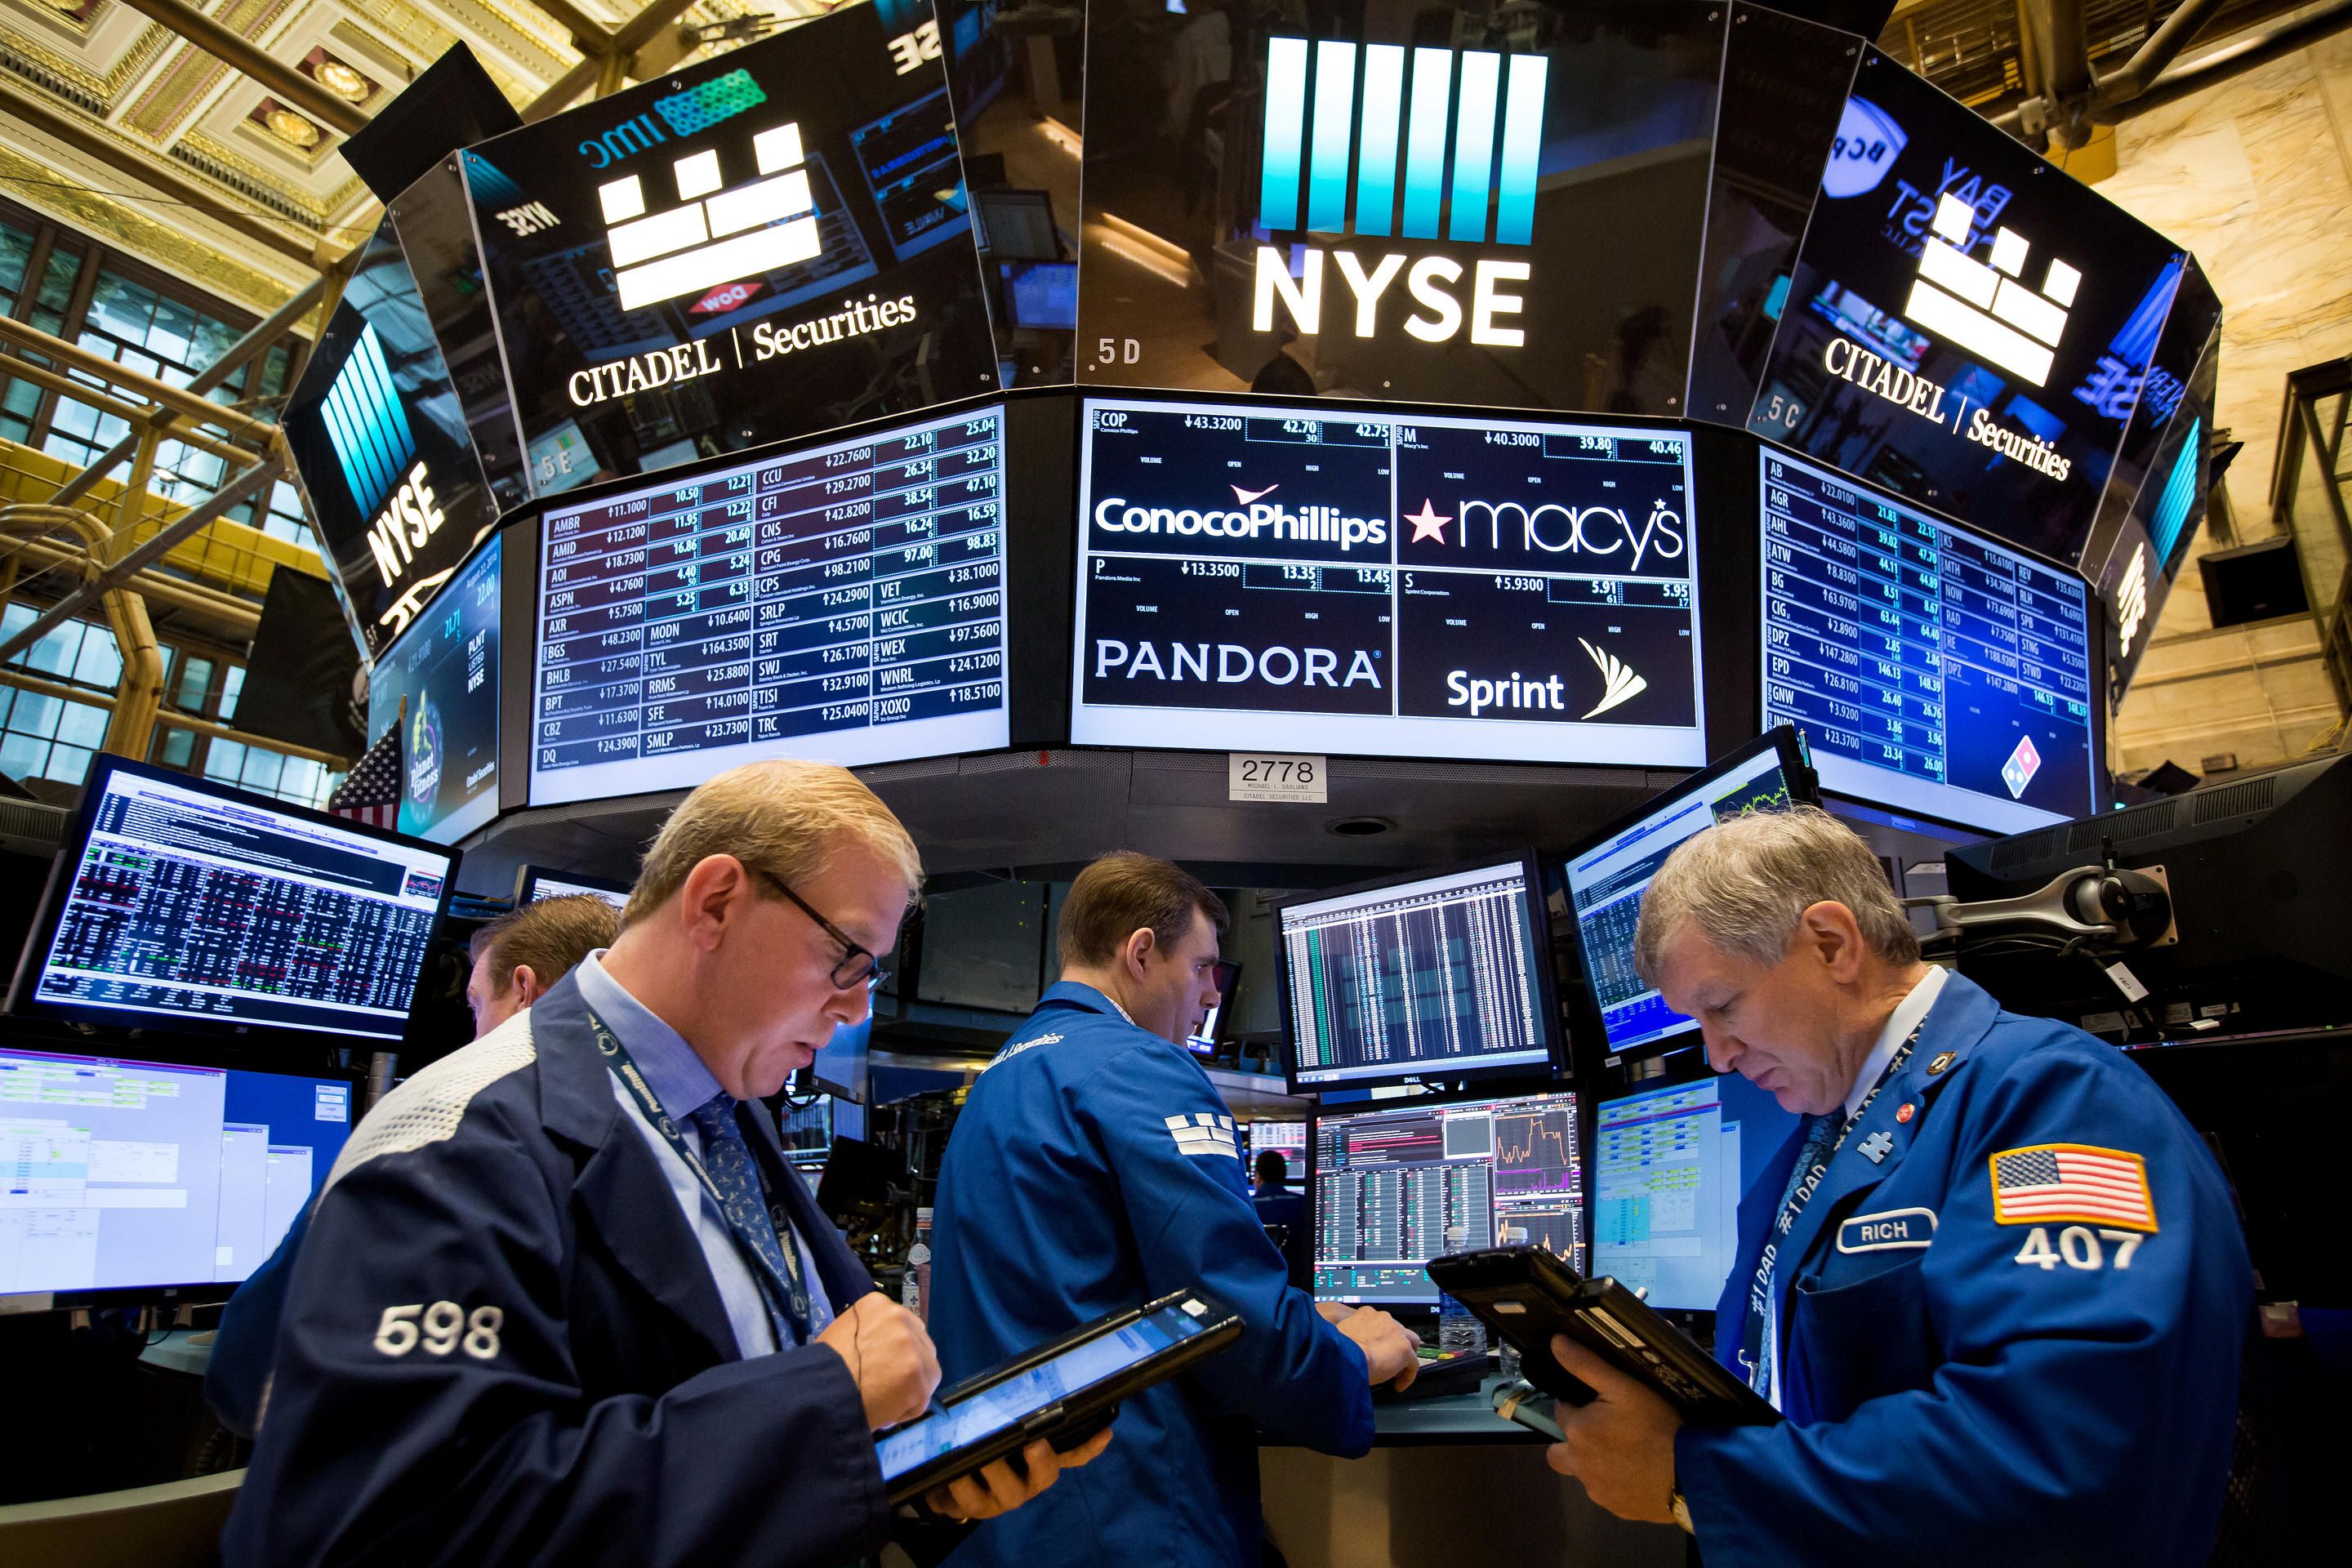
Ongoing Trade Concerns Weigh on US Stocks
By Investors Hub
The major U.S. index futures are currently pointing to a lower opening on Monday, with stocks likely to see some further downside following the pullback seen late in the previous session.
Ongoing concerns about the escalating U.S.-China trade dispute are likely to weigh on Wall Street after Google suspended some of its business with Chinese tech giant Huawei.
Google has cut Huawei off from business involving the transfer of hardware, software and technical services, complying with an order by President Donald Trump blocking the sale or transfer of U.S. technology to Huawei.
?We are complying with the order and reviewing the implications,? a Google spokesperson said, noting services such as Google Play and the security protections from Google Play Protect will continue to function on existing Huawei devices.
Overall trading activity may be somewhat subdued, however, as a lack of major U.S. economic data may keep some traders on the sidelines.
Reports on new and existing home sales and durable goods orders are likely to attract attention in the coming days along with the minutes of the latest Federal Reserve meeting.
Stocks showed wild swings over the course of the trading session on Friday before ending the day mostly lower. The major averages recovered from an initial move to the downside only to pull back sharply late in the session.
At the end of the day, the major averages were all firmly in negative territory. The Dow fell 98.68 points or 0.4 percent to 25,764.00, the Nasdaq slumped 81.76 points or 1 percent to 7,816.28 and the S&P 500 dropped 16.79 points or 0.6 percent to 2,859.53.
The major averages also closed lower for the week. The Nasdaq tumbled by 1.3 percent, while the Dow and the S&P 500 slid by 0.7 percent and 0.8 percent, respectively.
Reflecting recent market sensitivity to trade-related news, the late-day pullback came on the heels of a CNBC report indicating negotiations between the U.S. and China appear to have stalled.
Citing two sources briefed on the status of trade talks, CNBC said scheduling for the next round of negotiations is “in flux” because it is unclear what the two sides would discuss.
Sources told CNBC discussions regarding scheduling the next round of talks have not taken place since President Donald Trump signed an executive order ramping up scrutiny of Chinese telecom companies.
Lingering concerns about the escalating trade dispute between the U.S. and China also contributed to the initial weakness on Wall Street.
While Trump has sought to blame China for backing out of a nearly completed trade deal, a spokesperson for China’s Ministry of Commerce claims the U.S. is responsible for serious setbacks in the trade talks.
Commerce Ministry spokesperson Gao Feng accused the Trump administration of “bullying behavior” with a recent increase in tariffs, according to state-run Chinese news agency Xinhua.
“It is regrettable that the U.S. side unilaterally escalated trade disputes, which resulted in severe negotiating setbacks,” Gao said.
He added, “We urge the U.S. side to correct wrongdoings as soon as possible to avoid causing heavier damages to businesses and consumers in both countries and dragging down the global economy.?
However, concerns about trade waned after the Trump administration officially delayed imposing tariffs on imported automobiles and parts for up to six months, confirming media reports from earlier this week.
A White House statement noted Trump has directed U.S. Trade Representative Robert Lighthizer to negotiate agreements to address the national security threat posed by auto imports.
On the U.S. economic front, the University of Michigan released a report showing a substantial improvement in consumer sentiment in May, although the data was recorded mostly before trade negotiations with China collapsed.
The preliminary report showed the consumer sentiment index surged up to 102.4 in May from 97.2 in April, reaching its highest level in fifteen years. Economists had expected the index to inch up to 97.5.
Oil service stocks showed a substantial move to the downside over the course of the trading session, dragging the Philadelphia Oil Service Index down by 3.2 percent. The sell-off by oil service stocks came amid a modest decrease by the price of crude oil.
Significant weakness also emerged among semiconductor stocks, as reflected by the 2 percent slump by the Philadelphia Semiconductor Index.
Natural gas, oil producer, and networking stocks also saw considerable weakness on the day, notable strength was visible among computer hardware stocks.
Shares of Cray Inc. (CRAY) soared 22.5 percent after she supercomputer maker agreed to be acquired by Hewlett Packard Enterprise (HPE) for $1.3 billion in cash.

By Adedapo Adesanya
The National Pension Commission (PenCom) has defended its decision to allow Pension Fund Administrators (PFAs) to invest in the parent companies of their custodians, insisting that adequate safeguards are in place to protect contributors’ funds.
The director-general of the pension regulator, Ms Omolola Oloworaran, speaking on Tuesday during the Meet the Press Briefing at the Presidential Villa, Abuja, said the commission’s decision to relax the investment restriction followed a comprehensive risk assessment that found minimal conflict of interest.
She explained that under PenCom’s investment regulations, PFAs are only permitted to invest pension assets in carefully selected instruments that meet stringent criteria, including profitability, strong credit ratings and proven track records.
According to her, the commission regularly reviews its investment regulations, conducts routine examinations and spot checks on PFAs to ensure strict compliance with established risk management guidelines.
“PFAs cannot just go into the stock market and buy any kind of stock. There are strict guidelines. Companies must demonstrate profitability, have a proven track record and satisfy other criteria before pension funds can invest,” she said.
Ms Oloworaran noted that each PFA also operates under the oversight of a board, an investment committee and a risk management committee, providing additional layers of governance to safeguard contributors’ funds.
She said PenCom recently issued a circular allowing PFAs to invest in the parent companies of their custodians after determining that the potential conflict of interest was negligible.
The PenCom boss explained that the parent companies involved are largely Tier-1 banks, including First Bank, United Bank for Africa (UBA) and Zenith Bank, which she described as A-rated institutions with strong financial foundations.
She said the policy was intended to widen investment opportunities for pension funds without compromising safety.
Using Stanbic IBTC as an example, Ms Oloworaran explained that if its custodian is Zenith Bank, the previous restriction prevented the pension administrator from investing in Zenith Bank shares despite the bank’s strong performance.
“We reviewed the risks and any potential conflict of interest and found the risks to be very low. That is why we opened that investment window,” she said.
By Aduragbemi Omiyale
Analysts at Meristem Research have predicted that the inflation rate for June 2026 in Nigeria should marginally rise to 15.95 per cent on a year-on-year basis from the 15.93 per cent reported in May 2026.
The National Bureau of Statistics (NBS) is expected to release inflation numbers for last month later today, Wednesday, July 15, 2026.
In its report sighted by Business Post, Meristem Research said it expects inflationary pressures to re-emerge across key economies in the near term, as the re-escalation of the US-Iran conflict has reignited upward pressure on global oil prices.
It disclosed that this marks a sharp reversal from most of June, when the ceasefire between the two countries helped drive oil prices lower, raising expectations of some relief on the inflation front.
With conflicts now flaring up again, oil prices are likely to increase again, and the anticipated easing in energy-driven inflation may not materialise as broadly as earlier envisaged.
“Nonetheless, some relief is likely from the food segment, where robust supply conditions across major producing regions and softening demand should continue to ease food price pressures,” it stated.
The team also explained that it projected a 15.95 per cent inflation rate because of the lingering effects of persistent food price pressures.
“However, we expect core inflation to moderate as the sharp reversal in energy prices begins to filter through to transportation, distribution, and other energy-related costs, easing underlying price pressures.
“On a month-on-month basis, the combined effect of lower petrol prices, a relatively stable Naira, and the gradual pass-through of reduced energy costs across the supply chain should exert further downward pressure on inflation.
“Based on our assessment, food inflation is expected to remain the key swing factor, as seasonal pre-harvest supply constraints are likely to offset some of the gains from lower logistics costs,” it said.

By Adedapo Adesanya
The duo of Central Securities Clearing System (CSCS) Plc and Afriland Properties Plc weakened the NASD Over-the-Counter (OTC) Securities Exchange by 1.61 per cent on Tuesday, July 14.
CSCS Plc saw its stock value drop N9.08 to close at N82.40 per share compared with the preceding session’s N91.48 per share, and Afriland Properties Plc slid by 17 Kobo to sell at N15.00 per unit versus N15.70 per unit.
The losses recorded by the two securities pulled back the market capitalisation by N41.64 billion to N2.546 trillion from N2.587 trillion, and cracked the NASD Security Index (NSI) by 69.36 points to 4,242.31 points from 4,311.67 points.
It was observed that the exchange witnessed two price advancers during the session, led by FrieslandCampina Wamco Nigeria Plc, which gained N1.37 to end at N151.37 per share compared with the previous day’s N150.00 per share, and Food Concepts Plc chalked up 5 Kobo to settle at N2.50 per unit versus N2.45 per unit.
The volume of securities traded by market participants surged by 50.7 per cent to 13.7 million units from the previous 9.1 million units, while the value of securities went down by 79.7 per cent to N65.2 million from N320.4 million, and the number of deals crashed by 3.6 per cent to 27 deals from the previous session’s 28 deals.
At the close of transactions, Great Nigeria Insurance (GNI) Plc remained the most traded stock by value on a year-to-date basis, with the sale of 3.4 billion units for N8.4 billion, trailed by Infrastructure Credit Guarantee (Infracredit) Plc, which exchanged 2.3 billion units valued at N6.5 billion, and CSCS Plc with 73.9 million units transacted for N5.2 billion.
GNI Plc also closed the trading day as the most traded stock by volume on a year-to-date basis, with 3.4 billion units worth N8.4 billion, followed by Infracredit Plc with 2.3 billion units traded for N6.5 billion, and Resourcery Plc with 1.1 billion units valued at N415.7 million.
