
Economy
Qfac Pick of the Week: United Bank for Africa (UBA) Plc
By Quantitative Financial Analytics Ltd
Though UBA Plc price fell from N11.24 to N11 during the last trading day, this week’s Qfac pick is United Bank for Africa, (UBA) Plc and our analysis is pointing to a buy signal.
United Bank for Africa Plc is a financial institution in Nigeria engaged in corporate, commercial and retail banking as well as trade services, cash management, treasury and custodial services with branches African countries. Our buy signal derives from the following:
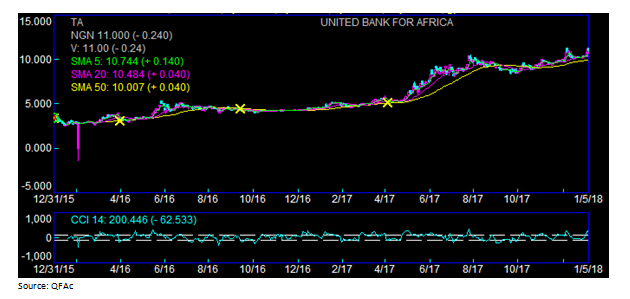
Moving Average Analysis: The latest price of N11.00 beats its 5-Day, 5 5-Day, 50-Day, and 100-Day moving average prices. Most technical analysts use the moving average rule that recommends a buy when a market close crosses above x day moving average, while a sell is signalled when a market close crosses below x day moving average (where x could be any number of days)

Commodity Channel Index: Though most chartists use the CCI as an overbought/oversold oscillator, it could be used to signal buys or sells. CCI compares current price with average price over a period of time CCI readings of above 100 indicate a buy while those below -100 indicate a sell. Our CCI index for UBA based on a 14- week period is 200.45
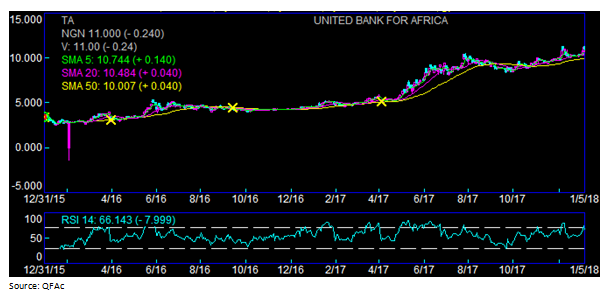
Relative Strength Index (RSI): According to Welles Wilder, who introduced RSI in 1978, market tops are often completed when the RSI rises above 70 while bottoms are formed during periods when the RSI falls below 30. Most analysts prepare to buy as prices dip below 30 using a rise back to 30 as a buy signal and prepare to sell when the RSI moves above 70. This is premised on the notion that RSI of 70 and above indicate that a stock is becoming overbought or overvalued and could be getting ready for a reversal while an RSI value of 30 and below indicate an oversell or an upcoming reversal. Our chart shows that UBA has an RSI of 66.143 which is below the overbought mark, we call it a buy especially for the day traders but could be a hold for longer tern traders.
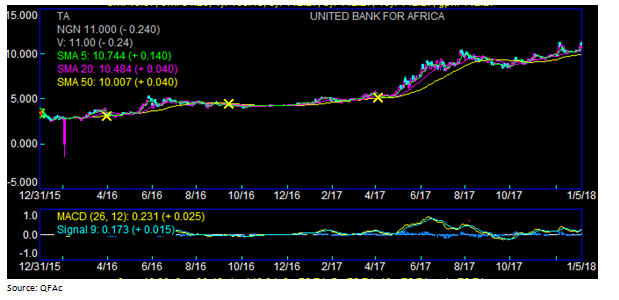
Moving Average Convergence Divergence (MACD): The MACD uses two lines to signal a buy or a sell, the faster line (MACD) and the slower line (signal). The actual buy or sell signals are given when the two lines cross, such that a crossing by the faster MACD line above the slower signal line indicates a buy while a crossing of the MACD line below the signal line indicates a sell. For UBA, the MACD line just crossed the signal line indicating a buy
Stochastic Oscillator: The Stochastic indicator also uses two lines to signal buys or sells, the %K and %D lines. Buy signals are indicated when the fast %K line rises above 30 accompanied by a cross above the fast %D line while sell signals are indicated when the fast %K stochastic line falls below 80 and accompanied by a cross below the fast %D stochastic line.

As indicated above, the fast %K rose above 30 and crossed above the fast %D on December 27 indicating a buy.
Summary: Based on the above technical charts, we believe that the technical analysis is pointing to a buy signal for UBA.
For complete list of picks or for analysis of any stock of interest, contact An*******@****************ia.com
By Adedapo Adesanya
The Nigerian Upstream Petroleum Regulatory Commission (NUPRC) will, at the Commercial Bid Conference, announce the successful bidders for 50 oil and gas blocks in the 2025 Licensing Round on July 21, 2026.
The regulator said the conference would conclude an eight-month licence round that began on December 1, 2025, after President Bola Tinubu approved the exercise under the Petroleum Industry Act (PIA) 2021.
The commission said the 50 blocks include 15 onshore, 19 shallow-water, 15 frontier and one deep-offshore block, covering basins such as the Niger Delta, Chad Basin, Benue Trough, Anambra and Bida.
It said the round aims to attract about $10 billion in fresh investment and to unlock discovered but undeveloped fields, fallow assets and gas resources. NUPRC described the 2025 round as the third licensing exercise under the PIA framework and stressed it is designed to prioritise natural gas development.
NUPRC outlined a five-stage process for the round — registration and pre-qualification, data acquisition, technical bid submission and evaluation, and the commercial bid conference — followed by ministerial approval and contracting. The Commission said it notified pre-qualified applicants on March 16, 2026, and closed technical and commercial bids on June 12, 2026.
NUPRC chief executive, Mrs Oritsemeyiwa Eyesan, had said the selection would be merit-based and would exclude weaker applicants.
She said only candidates with strong technical and financial credentials, professionalism and credible development plans would advance, and that winners would be chosen on a weighted combination of technical and commercial scores.
To widen participation, the federal government fixed signature bonuses for the round in a prescribed range of $3 million to $7 million per block, the Commission said, adding that bids outside that range would be non-compliant and excluded.
NUPRC said it would resolve the tied highest bids within the range by conducting a sealed rebid for the signature bonus, adding that successful bidders will receive Petroleum Prospecting Licences (PPLs) and may elect either a Concession or a Production Sharing Contract (PSC) framework, noting that the choice of framework will determine fiscal terms for up to two decades.
The agency noted that bidders were required to present host community development plans and to commit to remit 3 per cent of operating expenditure to Host Community Development Trusts. It said decarbonisation objectives and broader environmental, social and governance (ESG) requirements were mandatory parts of submissions.
It warned that applicants with government debts, those that had previously failed to develop licences “vigorously and in a business-like manner,” or those found non-compliant with applicable laws could be disqualified at any stage.
The regulator said it expects ministerial approval and formal contracting between July and October 2026, after which awardees must execute concession contracts before licences take legal effect.
Recall that during the 25th Nigeria Oil and Gas (NOG) Energy Week in Abuja, the NUPRC issued PPLs to 12 companies across 19 blocks from the 2024 round. The Commission named recipients, including Boron Energy Limited, Energy Marketing and Supply Limited, Sahara Deepwater Resources Limited, Tulkan Energy E&P Company Limited and said that the exercise showed the licensing pipeline was functioning.

By Adedapo Adesanya
The Special Adviser to the President on Energy, Mrs Olu Verheijen, has said Nigeria requires about $38.3 billion in fresh investment to sustain current oil and gas production and achieve its 2030 output targets.
Speaking at the recently concluded 25th NOG Energy Week Conference and Exhibition in Abuja, Mrs Verheijen said global investors are now prioritising countries with predictable policies, competitive fiscal terms and credible regulatory systems.
“For Africa, that question is urgent. And for Nigeria, the scale of the task is equally clear: to sustain the current base and grow toward our 2030 production target, analysis shows a financing gap of about $38.3 billion,” she said.
According to her, the era when countries relied solely on resource endowment to attract capital has ended.
“Capital has no passport. It is rational. It prices risk. It follows credibility. It asks one question: can this country turn resources into bankable projects, and bankable projects into reliable returns?”
She said Nigeria had deliberately repositioned itself through reforms aimed at improving investor confidence and accelerating project execution.
“We recalibrated fiscal terms, clarified regulation and streamlined oversight. We introduced targeted incentives and cut contracting timelines by more than half. We made a clear statement to the world: Nigeria is no longer asking to be trusted; Nigeria is working to be bankable.”
Highlighting progress recorded under the reforms, Verheijen said Nigeria now has more than $50 billion worth of upstream projects in its visible investment pipeline.
“We now have more than 50 billion dollars of upstream projects in the visible pipeline. In the last three years, more than 10 billion dollars of long-awaited final investment decisions have come through.”
She added that crude oil and condensate production has increased by about 400,000 barrels per day since 2023, while onshore production is at its highest level in two decades.
“Crude oil and condensate production has risen by about 400,000 barrels per day since 2023. Onshore production is at its strongest level in twenty years.”
Mrs Verheijen said the Federal Government remains committed to achieving its target of producing three million barrels of oil per day and 10 billion standard cubic feet of gas daily by 2030, while strengthening Nigeria’s competitiveness in the global energy market.
She also highlighted ongoing reforms in the power sector, including the N4 trillion Presidential Power Sector Financial Reforms Programme, which she described as critical to restoring confidence across Nigeria’s electricity value chain.
On gas development, she said the government was expanding domestic LPG supply, improving affordability and supporting investments through tax and import duty incentives.
“A gas-rich nation cannot be comfortable when families are priced back to firewood, charcoal or kerosene,” she said.
Mrs Verheijen stressed that Nigeria’s ambition extends beyond exporting crude oil to building an industrial economy anchored on value addition.
“We have chosen not merely to produce molecules, but to convert molecules into megawatts, fertiliser, petrochemicals, mobility, manufacturing, jobs and exports.”
She concluded that the country’s reforms were laying the foundation for long-term growth despite lingering challenges.
“The age of Nigerian hesitation is ending. The age of Nigerian ambition has begun. Our task now is to turn reform into relief, capital into projects, projects into jobs, and energy into national greatness.”
By Adedapo Adesanya
Nigeria’s headline inflation rate in June 2026 moderated to 15.91 per cent from 15.93 per cent in May, as pressure from the Iran war mildly eased, though it largely remained in focus during the review month.
In the report on Wednesday, the statistical office showed that the headline inflation rate for June on a month-on-month basis was 1.66 per cent, 0.09 per cent lower than the 1.75 per cent recorded in May 2026.
On an annualised basis, the print was down from 25.29 per cent in the same month of the preceding year (June 2025). This was due to the rebasing of the calculation year from 2009 to 2024.
The rise in prices, which stemmed from the continued conflict in the Middle East, continued to stoke food prices and energy costs, which account for a huge chunk of average spending.
The food inflation rate in May 2026 on a month-on-month basis was 3.75 per cent, up by 0.77 percentage points from May 2026 (2.98 per cent), while on a year-on-year basis, it was 17.52 per cent and stood at 25.41 per cent in the same month of the preceding year (June 2025).
At 15.91 per cent print, the inflation marginally beat expectations by Meristem Research, predicted at 15.95 per cent.
There had been expectations that the ceasefire between the United States and Iran would help drive oil prices lower, raising expectations of some relief on the inflation front. However, with conflicts now flaring up again, oil prices are likely to increase again, and the anticipated easing in energy-driven inflation may not materialise as broadly as earlier envisaged.
Meristem Research said it expects inflationary pressures to re-emerge across key economies in the near term, as the re-escalation of the US-Iran conflict has reignited upward pressure on global oil prices.
This will be a core factor that the Monetary Policy Committee (MPC) of the Central Bank of Nigeria (CBN) will be looking at when it meets for the next policy meeting. At its last meeting, the committee left benchmarked interest rates at 26.5 per cent.
