
Economy
Tesla’s Market Influence: What Makes It One of the Most Watched Stocks Globally

Some stocks get noticed for a moment, and others stay in the spotlight for years. Tesla sits firmly in that second category. Even people who don’t follow financial markets closely tend to hear about its price swings, its momentum, and the conversations around where it might go next. It’s one of those names that seems to move at its own pace, sometimes dragging entire market discussions along with it.
A lot of that attention comes from how widely it’s tracked. Financial summaries, analyst reports, and market commentary often highlight performance data from platforms like Exness, where Tesla stocks are listed as a point of reference. For many investors and curious observers, that listing isn’t just a chart or a ticker. It’s a quick snapshot of sentiment, risk appetite, and broader market behavior.
Why This Company’s Stock Draws So Much Attention
The first thing that stands out about Tesla’s presence in the market is how quickly its price can move. Some stocks maintain steady trends, barely shifting from one week to the next. Tesla tends to do the opposite. It reacts sharply to earnings reports, economic indicators, leadership comments, and even hints about future projects.
These movements often spark conversations about volatility, innovation, and long term growth. For young investors learning how markets work, Tesla becomes an early case study. For larger institutions, it’s a stock that can influence portfolio performance more than expected. The combination of fast movement and strong public interest creates an environment where every shift feels meaningful.
A Stock That Reflects Broader Market Mood
One reason analysts treat Tesla’s price action as important is because it often mirrors broader market emotions. When investors feel optimistic, risk-tolerant, or future-focused, Tesla’s stock tends to benefit. When the mood becomes cautious or uncertain, the stock can soften just as quickly.
This relationship doesn’t mean the company itself changes dramatically overnight. It means investor psychology is a powerful force. By watching how Tesla behaves during periods of strong economic news or global tension, market observers get a sense of how much confidence is circulating in the system.
Public Interest Shapes How the Market Reacts
Tesla isn’t just a financial asset. It’s also a cultural conversation point. People debate its future, its projects, and its leadership more openly and frequently than most companies receive. This constant attention keeps the stock tied to public sentiment, which isn’t always predictable.
When a company attracts that kind of interest, markets react not only to official updates but also to discussions happening outside traditional finance circles. It adds an extra layer of energy around the stock, making its behavior more connected to public mood than to isolated financial signals.
How Growth Potential Makes It Stand Out
A big part of the fascination comes from growth potential. Investors are always looking for companies that seem positioned to shape the next decade. Tesla often appears in that group because of the industries it participates in.
Stocks tied to future-focused sectors behave differently from traditional companies because expectations play a larger role in price movement. Even small updates can shift assumptions about long term direction. Entrepreneurs, analysts, and traders all watch to see whether the company continues to align with those expectations or drifts away from them.
Why Tesla’s Movements Sometimes Influence Other Stocks
When Tesla rises sharply, it’s not uncommon to see similar companies experience momentum as well. This isn’t because they’re directly connected. It’s because investors sometimes treat Tesla’s movements as a sign of broader sector strength or weakness.
A sudden jump can make investors more optimistic about related industries, while a fast drop can spark caution. It’s a chain reaction driven by perception rather than direct links. In an interconnected market, perception matters almost as much as performance.
The Role of Institutional Investors
Institutional investment also shapes how Tesla behaves. When large funds increase or decrease their holdings, the impact can be significant because of how much volume they control. These decisions are often based on long term strategy, risk management, and sector outlooks.
Smaller investors sometimes follow these moves, interpreting them as signs of where the market is heading next. Institutions don’t always announce their decisions in real time, but when patterns emerge, they tend to influence sentiment across multiple regions and industries.
How Global Events Affect Tesla’s Price
Market watchers often note how Tesla responds to global events. A shift in interest rates, a major economic report, or a change in policy direction can spark movement in its price. Even events unrelated to the company can create reactions because they influence investor confidence.
This doesn’t make Tesla unpredictable. It simply means it’s sensitive to the same global forces that move other major assets. What makes it stand out is how clearly those reactions appear compared to slower-moving stocks.
What Oil Prices Reveal About Market Conditions
Oil also plays a role in understanding market behavior. When oil prices rise or fall, they influence transportation, production costs, and overall economic pressure. Some investors look at tools such as the USOIL stock price chart on Exness as a reference when evaluating how different sectors might react to global conditions.
Tesla’s stock doesn’t mirror oil prices directly, but both exist within the same economic environment. When energy costs shift, so does investor perception of global stability. Understanding those changes helps explain why certain stocks move more actively during periods of oil volatility.
Why Long Term Vision Matters More Than Short Term Swings
While short term price changes attract attention, long term direction is where most meaningful insights appear. Tesla’s influence comes from its ability to shape expectations about the future. Investors who focus only on daily movement may miss the broader patterns unfolding beneath the noise.
Over years, markets reward companies that maintain innovation, adapt to challenges, and stay aligned with shifting demand. Tesla’s story continues to unfold, and its market presence reflects that ongoing evolution.
Final Thoughts
Tesla remains one of the most watched stocks because it captures a blend of innovation, volatility, public interest, and long term potential. Its price movements tell part of the story of global sentiment, market confidence, and investor expectations.
For anyone trying to understand how markets behave, following Tesla offers a window into the forces that shape modern investing. Not because the stock predicts everything, but because it reflects how today’s investors think, react, and imagine the future.
By Adedapo Adesanya
The Federation Account Allocation Committee (FAAC) distributed about N2.550 trillion from the revenue generated by the nation in June 2026 to the three tiers of government after its July meeting in Abuja.
A statement signed by the Director of Press in the Office of the Accountant General of the Federation, Mr Bawa Mokwa, “The N2.550 trillion total distributable revenue comprised N1.809 trillion in distributable statutory revenue and N740.724 billion in distributable Value Added Tax (VAT) revenue.”
It was gathered that a total gross revenue of N4.500 trillion was available in June 2026, with deductions for the cost of collection amounting to N160.744 billion, and transfers and refunds at N1.789 trillion.
According to a communiqué after the gathering, gross statutory revenue of N3.700 trillion was received in June 2026, N1.049 trillion higher than the N2.651 trillion received in the preceding month, while gross revenue of N799.746 billion was generated from VAT, N56.058 billion higher than the N743.688 billion recorded in May 2026.
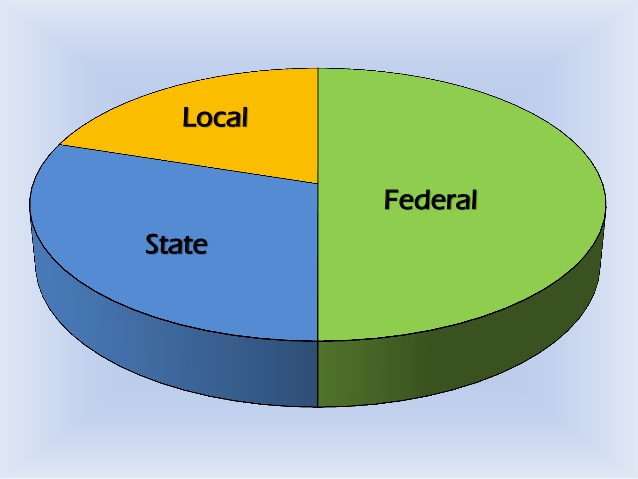
It was stated that from the N2.550 trillion total distributable revenue, the federal government received N923.438 billion, the state governments got N838.208 billion, while the local government councils were given N591.390 billion, with N197.610 billion allocated to the benefiting states as 13 per cent of mineral derivation revenue.
From the N1.809 trillion distributable statutory revenue, the federal government went away with N849.366 billion, states shared N430.810 billion, local councils took N332.136 billion, while the benefiting states got N197.610 billion as derivation revenue.
From the N740.724 billion distributable VAT earnings, the central government got N74.072 billion, the states received N407.398 billion, and the local government councils were allocated N259.253 billion.
The communiqué further stated that in June 2026, collections from Companies Income Tax (CIT), Capital Gains Tax (CGT), Stamp Duties (SDT), Petroleum Royalties, Gas Flare Penalties, Rent, Mineral Oil Royalties (MOR), Value Added Tax (VAT), Import Duty, and Common External Tariff (CET) Levies increased significantly, while Petroleum Profit Tax (PPT), Hydrocarbon Tax (HT), Mineral Royalties, and Fees declined considerably. Excise Duty recorded only a marginal increase.
By Adedapo Adesanya
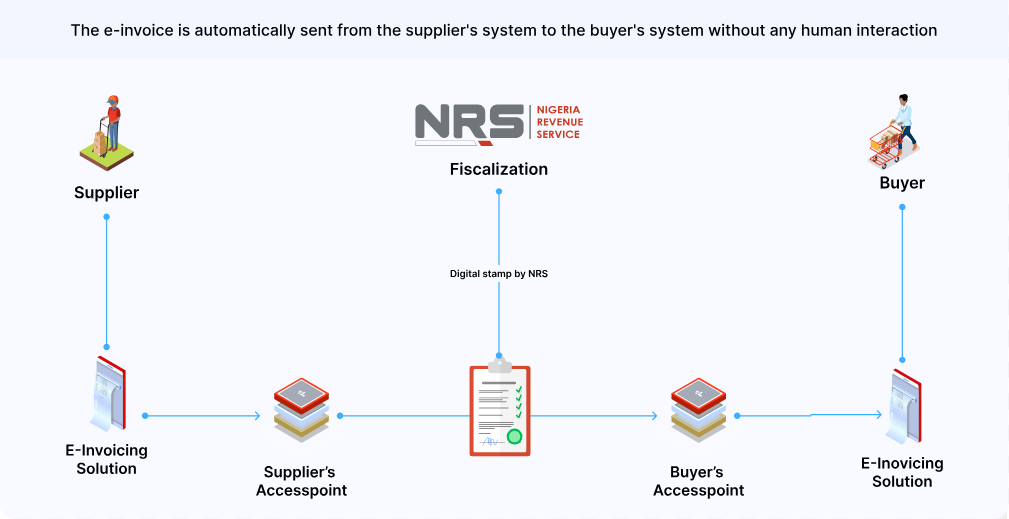
The Nigeria Revenue Service (NRS) says the rollout of electronic invoicing (e-invoicing) will strengthen tax compliance, curb revenue leakages and improve transparency in tax administration as it moves to fully digitise the country’s tax system.
The Project Lead for the NRS e-Invoicing Project, Mr Mohammed Bawa, stated this at the DigiTax E-Invoicing Compliance Breakfast Session held in Lagos on Wednesday.
The event, organised by DigiTax, an NRS-accredited e-invoicing platform, formed part of efforts to support the agency’s ongoing education and sensitisation campaign on the e-invoicing mandate.
Mr Bawa said the initiative aligns with global trends in tax digitisation and is expected to help improve Nigeria’s tax-to-GDP ratio, which remains one of the lowest in Africa.
According to him, the system will provide the NRS with greater visibility into transactions across sectors, formalise activities within the informal economy and standardise invoice formats nationwide using globally recognised invoice schemas.
He added that e-invoicing would improve operational efficiency for both businesses and tax authorities while supporting the NRS’ transition from manual and electronic tax administration processes to a fully automated system-to-system interaction model.
Mr Bawa noted that the legal framework for implementation is backed by the Nigeria Tax Administration Act, which prescribes penalties for non-compliance.
He disclosed that the NRS has completed onboarding large taxpayers and is preparing to enforce compliance with defaulting entities.
According to him, medium taxpayers are expected to begin compliance in the third quarter of 2026, while onboarding of emerging taxpayers will commence in 2027, with full adoption targeted for all taxpayers by the end of 2028.
Mr Bawa urged taxpayers yet to be onboarded onto the platform to begin the process and work with accredited service providers to ensure compliance.
On his part, Country Director of DigiTax Nigeria, Mr Olumide Akinsola, urged businesses to look beyond their internal systems and assess the compliance status of suppliers and counterparties.
He warned that businesses whose suppliers fail to transmit invoices through the MBS platform risk losing eligibility to claim Value Added Tax (VAT) input credits on such transactions, describing the resulting supply chain exposure as a significant commercial risk that many organisations have yet to quantify.
Mr Akinsola also announced the launch of DigiTax’s white paper, The State of E-Invoicing Readiness in Nigeria, which examines compliance adoption trends and the readiness gap across different taxpayer segments.
He added that DigiTax operates in Nigeria, Kenya, Zambia and the United Arab Emirates (UAE), noting that experience from those markets shows businesses that integrate early are better positioned to avoid disruptions when enforcement begins.

By Aduragbemi Omiyale
The names of about 100,000 companies registered by the Corporate Affairs Commission (CAC) are about to be deleted for inactivity, especially for failing to file their annual tax returns, Business Post reports.
This information was disclosed by the CAC via a notice signed by its management on Wednesday, July 15, 2026.
The list contains organisations like the Nigeria-Poland Chamber of Trade Invest Ltd, Alariwo of Afrika Ltd, Ovation Sports International, First Union Pension Fund Administrators, Investopedia Limited, Baptist High School Abuja Ltd, and Yobe Aluminium Manufacturing Industries Ltd, amongst others.
In the statement, the commission said its decision to strike off the names of the affected firms from the register aligns with the provisions of Section 692(3) (3) and (4) of the Companies and Allied Matters Act (CAMA), 2020.
However, the affected companies can still salvage the situation by filing all outstanding annual returns and regularising their records within 90 days.
“Please note that companies that fail to comply within the stipulated timeline shall be struck off the register without further notice,” it declared, expressing its continued commitment to providing prompt and efficient registration and regulatory services to the satisfaction of its valued customers.
See the full list below:
