
Economy
What You Need to Know About Nigerian Bureau of Statistics GDP Rebasing
By David Okon
Every economy evolves, shaped by changing consumption patterns, emerging industries, and shifting global dynamics. To accurately reflect these changes, countries periodically undertake a statistical exercise known as rebasing. This ensures that national accounts capture the current structure and performance of the economy rather than relying on outdated benchmarks.
For Nigeria, the National Bureau of Statistics (NBS) has just completed a significant rebasing of its GDP figures, moving the base year from 2010 to 2019; a crucial update aimed at providing more relevant, timely, and accurate economic data.
Despite its importance, rebasing is often misunderstood by the general public. Many assume it automatically means economic growth or an improvement in living standards, which isn’t always the case.
To help clear up these misconceptions and provide clarity, we sat with an expert in national accounting, Mr Moses Waniko, to answer some questions that shed light on what rebasing truly mean, and why they matter for everyday Nigerians.
What is GDP and GDP growth, and why are these statistics important?
The Gross Domestic Product is the market value of all goods and services produced within a country in each period. It measures overall economic activity and signals the direction of economic growth. It is also a barometer to measure the health of the economy. It is an internationally recognized indicator for measuring the size of an economy in each period of time. The GDP growth rate is a measure of the rate of change that a nation’s gross domestic product (GDP) experiences from one period to another either annually or quarterly.
Is GDP growth synonymous with economic development?
No, GDP growth is not synonymous with economic development. Development encompasses broader measures of human progress beyond measuring output (GDP) growth, which mostly measures economic progress. In addition to measures of economic progress, development includes social and environmental measures that are not well captured by GDP.
What are the approaches for computing GDP?
There are three approaches to computing GDP, which are;
The Expenditure Approach: This approach captures spending by key economic agents in an economy. It is the sum of consumption expenditures by households, investments expenditures by firms, government expenditures, as well as the difference between exports and imports: GDP = C + I + G + (EX – IM).
The Income Approach: This approach measures the income earned by various factors of production. It is a sum of: compensation to workers, rental income, taxes on production and imports (less subsidies), interest, miscellaneous payments, and depreciation.
The Production or Value-Added Approach: Gross output (GO) less the purchase of intermediate inputs used to produce the final products.
Q4 What is GDP rebasing/re-benchmarking?
Rebasing/re-benchmarking of the national account series (GDP) is the process of replacing an old base year used to compile volume measures of GDP with a new and more recent base year or price structure. Economies are dynamic in nature. They grow, they shrink; they add new sectors, new products and new technologies, and consumer behaviour and tastes change over time.
Rebasing/Re-benchmarking is used to account for these changes, so as to give a more current snapshot of the economy, as well as improve the coverage of economic activities included in the GDP compilation framework. The base year provides the reference point to which future values of the GDP are compared. It is a normal statistical procedure undertaken by the national statistical offices of countries to ensure that national accounts statistics present the most accurate reflection of the economy as possible.
What are the key benefits of rebasing/re-benchmarking?
The key benefit of the rebasing exercise is that its results enable policy makers and analysts obtain a more accurate set of economic statistics that is a truer reflection of current realities for evidence-based decision-making. It also reveals a more accurate estimate of the size and structure of the economy by incorporating new economic activities that were not previously captured in the computational framework.
Rebasing will enable government to have a better understanding of the structure of the economy, an indication of sectoral growth drivers, sectors where policies and resources should be channeled in order to grow the economy, create jobs, improve infrastructure and reduce poverty.
How often should a country rebase?
The UN Statistical Commission (UNSC) recommends that countries rebase every five years. However, some countries do at intervals of less than five years.
Why is Nigeria rebasing the GDP at an interval more than recommended by the UNSC?
GDP rebasing is a resource intensive project. It requires major surveys that are highly capital intensive such as the Nigeria Living Standard Survey (NLSS), Agricultural Census and census/survey of establishments. The output of these surveys serves as input into the rebasing process. Sourcing the funds to conduct all of these surveys is always difficult hence the lag in rebasing interval.
What influenced the choice of the base year?
The last exercise was done in 2014. The UN Statistical Commission (UNSC) recommends that countries rebase their national accounts (GDP) estimates every five years. An “appropriate” base year is one for which data is readily available and which witnessed relative stability. Currently, Nigeria’s base year is 2010, but a new base year of 2019 has been selected for the rebasing exercise.
How long has it taken to complete this exercise?
The time from preparation to publishing of the result of the rebasing exercise took approximately five (5) years. The preparatory work for the rebasing exercise commenced in the last quarter of 2018. Since then, several activities have been undertaken some of which include field surveys for certain economic activities that were not adequately captured previously like the Research and Development (R&D), Trade and Transport Margin as well as Water Supply, Waste Management and Remediation. There was also validation with sector experts, and technical assistance from international development partners.
What methodology was used for this rebasing exercise?
The exercise was conducted in line with internationally-recognized methodology procedures and guides. The National Bureau of Statistics (NBS) started with an update of its survey frame, complemented by a listing exercise. Three major methodological pillars were used to compile the rebased GDP estimates: System of National Accounts (SNA 2008 version), International Standard Industrial Classification (ISIC Revision 4), and Central Product Classification (CPC version 2). Construction of Supply and Use Tables (SUT) for Nigeria Balance of Payment Version 6 Government Finance Statistics Manual 2014. These are the most up to date methodologies in National Accounting. Less than half of the countries in the world have been able to make these upgrades successfully. The SNA is the internationally agreed standard set of recommendations on how to compile measures of economic activity.
The ISIC is the international reference for the classification of productive activities. Its main purpose is to provide a set of activity categories that can be used for the collection and reporting of statistics according to such activities. The CPC is a classification based on the physical characteristics of goods or on the nature of services rendered. Each type of good or service distinguished in the CPC in such a way that it is usually produced by only one activity as defined by the ISIC. The CPC covers products that are output of economic activities. All of the above are applied into the Supply and Use Table (SUT).
The SUT contains a pair of tables, namely, the Supply table and the Use table. It combines the product balances of all individual products (or group of products) in a matrix framework to present a coherent picture of how goods are produced and then supplied versus how they are used within the whole economy. The development of the Supply and Use Table (SUT) formed the basis of the final estimates. Other refinements that were incorporated include the estimation of public administration, the conduct of the National Census on Commerce, Industries and Businesses (NCCIB) and the National Agricultural Sample Census (NASC). The data from these censuses were utilized in this rebasing.
Do the new numbers imply that Nigeria is now a richer country?
No, rebasing will not change the facts of our economy overnight. It will not make poverty and unemployment to disappear overnight, but will give us the tools and the policy ability to tackle these problems in order to reduce poverty and improve the welfare of our people. The rebased GDP numbers imply that the level of economic activity is much higher than previously reported. It indicates a clearer picture of Nigeria’s economic landscape and the significant opportunity for growth and wealth creation in the Nigerian economy.
Why are poverty and unemployment “high” when the economy is “doing well” as shown by rebased GDP?
The rebasing exercise has revealed that the key determinant of the expanding output/GDP growth has been the dominance of capital-intensive rather than labour-intensive activities. This suggests that increasing adoption of technology is leading to an expansion of output without the need to employ more labour. Rebasing does not change the challenges of poverty or unemployment but rather measures the economy more accurately so that policy can be designed to address them.
Of what importance is the rebasing exercise to the “common man”?
Rebasing the GDP does not correct for inequality (where the benefits of a higher GDP may be concentrated in a few hands) or solve poverty problems; rather it brings the comparison of GDP estimates to the closest picture of reality as possible. Having a better (and more accurate) picture of the economy is crucial to informing policy makers, investors, and even consumers on the current economic trends, which will help them make better informed decisions regarding their economic choices.
For example, policy makers may identify inequality as a factor inhibiting a more inclusive distribution of output/GDP growth and consequently design policies and programmes to address that inequality so that output/GDP growth is shared more equitably. It is in this way, the “common man” will feel the benefits of GDP rebasing exercise.
What is the impact of the rebased numbers on the Nigerian economy?
Nigeria’s GDP is expected to be a more accurate reflection of the structure and size of current economic activities in the country, presenting a clearer sectoral distribution and performance. As a result, better investment choices are expected to be made, resulting in higher profitability and even higher investments. This will help create jobs and also reduce poverty in Nigeria in the medium to long term.
Given the rebased estimates, does it mean that Nigeria’s GDP for the last 10 years has been inaccurate?
The rebased numbers are a better reflection of the true size and structure of the economy. It does not mean the old series are wrong; it means we are capturing more activities and measuring better.
What is the implication of the rebased GDP estimates on the real and nominal GDP?
Nominal GDP measures the level of economic activity using the current year’s price level and quantities to obtain the total value of goods and services. Real GDP measures the level of economic activity by making reference to a pre-selected base year, for the purpose of “cancelling out” price effects in the computation of the value of goods and services (to obtain the “real” value). Thus, at the base year, the nominal and real values of the GDP estimates are equal. As seen from the above question and answer session, the rebasing plays a critical role in unlocking a clearer, more accurate picture of Nigeria’s economic reality; when the most recent structure of the economy is captured, it reflects the true size and scope of economic activities. This update is essential not just for statistical accuracy, but for improved policy making and more informed decisions across both public and private sectors. It enhances Nigeria’s ability to attract investment, as current data builds investor confidence and economic credibility.
Furthermore, rebasing affects major indicators like the debt-to-GDP ratio, offering a more realistic gauge of fiscal sustainability and supporting long-term strategies for inclusive and sustainable growth. The recent rebasing of GDP by the National Bureau of Statistics, therefore, is a necessary step toward transparency, informed policy making, and sustainable economic planning. While misconceptions may persist, a better understanding of these tools empowers the citizens, investors, and leaders alike to engage with the economy from a place of knowledge rather than speculation.
David Okon is the Senior Consultant at Quadrant MSL

By Adedapo Adesanya
The chief executive of HBM Nigeria Plc (formerly Lafarge Africa), Mr Lolu Alade-Akinyemi, said the cement producer is expected to add 4.5 million tonnes to its production capacity by January 2027.
HBM Nigeria Plc is positioning itself for stronger long-term competitiveness, market leadership and job creation as it accelerates expansion projects.
The transition to HBM Nigeria marks a new phase of growth, driven by operational excellence, sustainability, innovation, and infrastructure development, while maintaining its long-standing commitment to Nigeria’s construction sector.
Mr Alade-Akinyemi, speaking recently in Lagos, said the ongoing expansion of the company’s Ashaka and Sagamu plants would significantly boost local production, create employment opportunities, and support businesses across its value chain.
“We recently announced the expansion of the Sagamu plant in Ogun State and the Ashaka plant in Gombe State. Hopefully, in January 2027, we will commission both plants, adding 4.5 million tonnes to our capacity. Traditionally, building a new plant takes about three years, but this is one of the benefits of belonging to the Huaxin Group,” he said.
According to him, the projects will generate employment, create opportunities for young people and women, strengthen local suppliers and contractors, and contribute further to Nigeria’s economic growth.
“There are many vacancies we are trying to fill in Sagamu and Ashaka. Beyond direct employment, we are creating opportunities for small businesses, developing suppliers and supporting local contractors. This is an exciting period because it will deliver significant benefits to Nigeria,” he said.
Mr Alade-Akinyemi noted that while the company’s corporate identity had changed following its acquisition by Huaxin Building Materials Group, its core values and commitment to customers, host communities, employees and shareholders remain unchanged.
He said HBM Nigeria traces its roots to 1959 as West African Portland Cement Company (WAPCO), with its first cement plant commencing operations in Ewekoro, Ogun State, in 1961.
Since then, he said, the company has grown into one of Nigeria’s leading building solutions providers with integrated plants in Ewekoro, Sagamu, Ashaka and Mfamosing.
He added that the company, which became publicly listed in 1979, has continued to expand through acquisitions and transformation while maintaining high product quality, innovation and responsible operations.
Highlighting the strengths of its parent company, Alade-Akinyemi described Huaxin Building Materials as a globally recognised building materials manufacturer founded in 1907 and headquartered in Wuhan, China, with operations across 16 regions in China and 14 countries worldwide.
He said Huaxin’s engineering expertise and focus on research and development would strengthen HBM Nigeria’s operations and help close engineering skills gaps in the country.
“As HBM Nigeria, we are strategically positioned for long-term competitiveness and stronger market leadership while reinforcing our commitment to supporting Nigeria’s infrastructure development and economic progress after more than six decades of industry leadership,” he said.
He also said sustainability would remain central to the company’s operations, noting that it had introduced lower-carbon products and continued to invest in environmentally friendly production processes.
By Adedapo Adesanya
The Federation Account Allocation Committee (FAAC) distributed about N2.550 trillion from the revenue generated by the nation in June 2026 to the three tiers of government after its July meeting in Abuja.
A statement signed by the Director of Press in the Office of the Accountant General of the Federation, Mr Bawa Mokwa, “The N2.550 trillion total distributable revenue comprised N1.809 trillion in distributable statutory revenue and N740.724 billion in distributable Value Added Tax (VAT) revenue.”
It was gathered that a total gross revenue of N4.500 trillion was available in June 2026, with deductions for the cost of collection amounting to N160.744 billion, and transfers and refunds at N1.789 trillion.
According to a communiqué after the gathering, gross statutory revenue of N3.700 trillion was received in June 2026, N1.049 trillion higher than the N2.651 trillion received in the preceding month, while gross revenue of N799.746 billion was generated from VAT, N56.058 billion higher than the N743.688 billion recorded in May 2026.
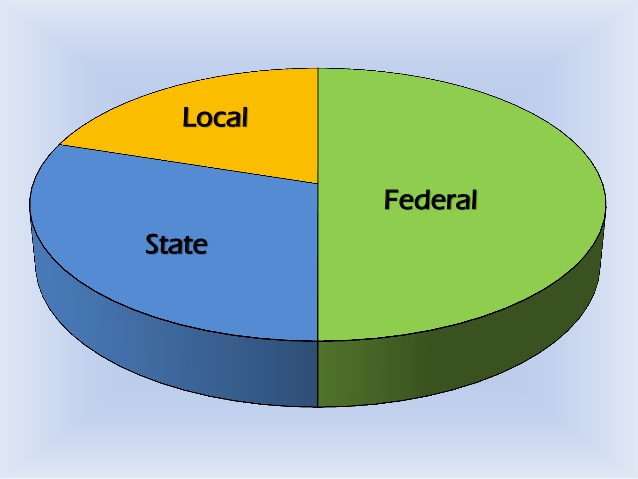
It was stated that from the N2.550 trillion total distributable revenue, the federal government received N923.438 billion, the state governments got N838.208 billion, while the local government councils were given N591.390 billion, with N197.610 billion allocated to the benefiting states as 13 per cent of mineral derivation revenue.
From the N1.809 trillion distributable statutory revenue, the federal government went away with N849.366 billion, states shared N430.810 billion, local councils took N332.136 billion, while the benefiting states got N197.610 billion as derivation revenue.
From the N740.724 billion distributable VAT earnings, the central government got N74.072 billion, the states received N407.398 billion, and the local government councils were allocated N259.253 billion.
The communiqué further stated that in June 2026, collections from Companies Income Tax (CIT), Capital Gains Tax (CGT), Stamp Duties (SDT), Petroleum Royalties, Gas Flare Penalties, Rent, Mineral Oil Royalties (MOR), Value Added Tax (VAT), Import Duty, and Common External Tariff (CET) Levies increased significantly, while Petroleum Profit Tax (PPT), Hydrocarbon Tax (HT), Mineral Royalties, and Fees declined considerably. Excise Duty recorded only a marginal increase.
By Adedapo Adesanya
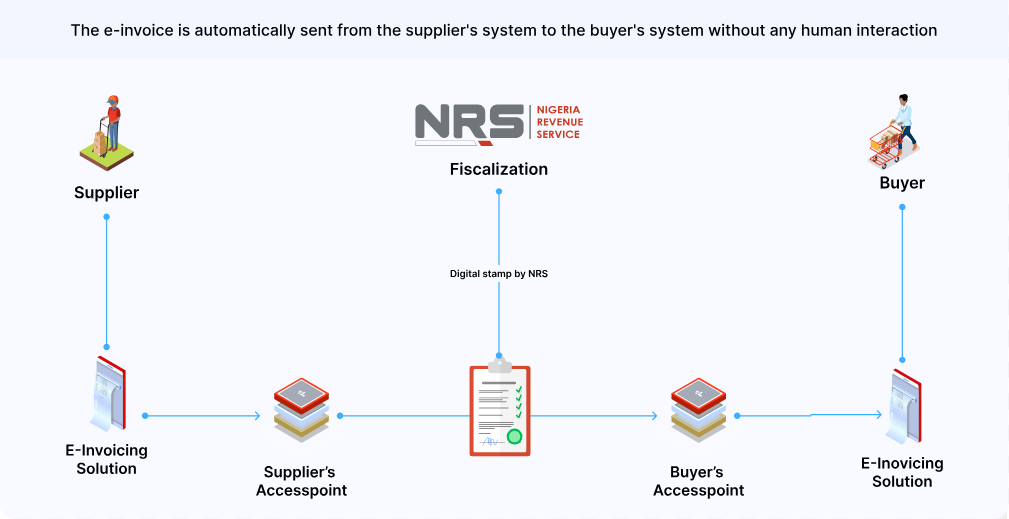
The Nigeria Revenue Service (NRS) says the rollout of electronic invoicing (e-invoicing) will strengthen tax compliance, curb revenue leakages and improve transparency in tax administration as it moves to fully digitise the country’s tax system.
The Project Lead for the NRS e-Invoicing Project, Mr Mohammed Bawa, stated this at the DigiTax E-Invoicing Compliance Breakfast Session held in Lagos on Wednesday.
The event, organised by DigiTax, an NRS-accredited e-invoicing platform, formed part of efforts to support the agency’s ongoing education and sensitisation campaign on the e-invoicing mandate.
Mr Bawa said the initiative aligns with global trends in tax digitisation and is expected to help improve Nigeria’s tax-to-GDP ratio, which remains one of the lowest in Africa.
According to him, the system will provide the NRS with greater visibility into transactions across sectors, formalise activities within the informal economy and standardise invoice formats nationwide using globally recognised invoice schemas.
He added that e-invoicing would improve operational efficiency for both businesses and tax authorities while supporting the NRS’ transition from manual and electronic tax administration processes to a fully automated system-to-system interaction model.
Mr Bawa noted that the legal framework for implementation is backed by the Nigeria Tax Administration Act, which prescribes penalties for non-compliance.
He disclosed that the NRS has completed onboarding large taxpayers and is preparing to enforce compliance with defaulting entities.
According to him, medium taxpayers are expected to begin compliance in the third quarter of 2026, while onboarding of emerging taxpayers will commence in 2027, with full adoption targeted for all taxpayers by the end of 2028.
Mr Bawa urged taxpayers yet to be onboarded onto the platform to begin the process and work with accredited service providers to ensure compliance.
On his part, Country Director of DigiTax Nigeria, Mr Olumide Akinsola, urged businesses to look beyond their internal systems and assess the compliance status of suppliers and counterparties.
He warned that businesses whose suppliers fail to transmit invoices through the MBS platform risk losing eligibility to claim Value Added Tax (VAT) input credits on such transactions, describing the resulting supply chain exposure as a significant commercial risk that many organisations have yet to quantify.
Mr Akinsola also announced the launch of DigiTax’s white paper, The State of E-Invoicing Readiness in Nigeria, which examines compliance adoption trends and the readiness gap across different taxpayer segments.
He added that DigiTax operates in Nigeria, Kenya, Zambia and the United Arab Emirates (UAE), noting that experience from those markets shows businesses that integrate early are better positioned to avoid disruptions when enforcement begins.
