
Economy
UBA Slashes Dividend by 56% Amid Rise in FY2020 Revenue, Profit

By Adedapo Adesanya
Tier-one lender, the United Bank for Africa (UBA) Plc, will pay its shareholders 35 kobo as final dividend for the fiscal year 2020.
Business Post observed that this represents a 56.3 per cent or 45 kobo decline from the 80 kobo paid in the corresponding period of 2019.
This is happening despite the group recording a 10.8 per cent increase in its gross earning for the year ended December 31, 2020, as there were significant increases in the three main operating segments.
The decision to cut the cash reward to investors may have been influenced by the harsh effect of COVID-19 pandemic on the business environment in the year under review.
This will be the first time in the last five years that the company will be paying a lower dividend. In the 2015 fiscal year, it paid shareholders 40 kobo per unit and in 2016, it was increased to 55 kobo per unit.
In 2017, UBA raised its dividend to 65 kobo per share and in the 2018 financial year, the dividend payout was retained at 65 kobo per unit, but it was increased to 80 kobo per share in the 2019 fiscal year.
A look at the performance of UBA last year showed that its revenue increased to N620.4 billion from N559.8 billion achieved in the previous year, indicating a N60.6 billion rise.
Business Post analysis further showed that in UBA’s three major business groups – Corporate banking; Retail/Commercial banking; and Treasury and Financial Markets, there were significant improvements on record.
At its corporate arm, which provides a broad range of financial solutions to multinational organisations and financial institutions, raked N201.0 billion as revenue, 10.8 per cent or N19.6 billion higher than N181.4 billion in 2019.
Its Retail/Commercial banking wing, which serves the middle and retail segments of the market, grew by 10.8 per cent or N20.9 billion to N214.4 billion from N193.5 billion in 12 months.
Also, the Treasury and Financial Markets, which provides innovative financing and risk management solutions and advisory services to UBA’s corporate and institutional customers, appreciated by 10.8 [per cent or N20.0 billion to N204.9 billion from N184.9 billion.
A look at the bottom line of the results showed that there was an increase in the Profit After Tax (PAT) by N24.7 billion or 27.7 per cent to N113.8 billion from N89.1 billion recorded in 2019.
In the financial statements released by the board to the Nigerian Stock Exchange (NSE), UBA said proposed final dividend of 35 kobo would be presented for approval to shareholders at the next Annual General Meeting (AGM) fixed for Thursday, April 1, 2021, at the UBA House in Lagos by 10:00am.

By Adedapo Adesanya
Despite signs that Nigeria’s headline inflation is easing, rising food prices continue to threaten the country’s inflation outlook, the chief executive of the Centre for the Promotion of Private Enterprise (CPPE), Mr Muda Yusuf, has warned.
He noted that structural inflationary pressures in the real economy remain pronounced despite improving macroeconomic stability.
In a policy brief released following the inflation report, he noted that headline inflation eased marginally, while month-on-month change moderated from 1.75 per cent to 1.66 per cent, indicating that headline inflation has largely plateaued.
According to him, the dominant concern in the latest inflation report is the renewed acceleration in food inflation.
This growth, he said, suggested that food prices have resumed an upward trajectory after a brief period of moderation.
Warning that a renewed increase in food inflation has significant economic and social implications, he stressed that food inflation remained the biggest driver of Nigeria’s cost-of-living crisis, stressing that rising food prices continue to erode household purchasing power, worsen poverty and food insecurity while weakening the inclusiveness of the current reform programme.
He maintained that sustained moderation in food prices is critical to improving citizens’ welfare and strengthening public confidence in the ongoing economic reforms.
Acknowledging the easing of core inflation as encouraging, he drew attention to the persistence of urban inflation.
At 16.08 per cent, urban inflation exceeded the national headline inflation rate of 15.91 per cent, while month-on-month urban inflation increased from 1.99 per cent to 2.13 per cent.
According to Mr Yusuf, the figures indicated that inflationary pressures remained particularly intense across urban centres.
He attributed the rising urban inflation partly to increasing population displacement from rural communities affected by insecurity, expressing worry that as more households migrate to urban areas, demand for housing, transportation, utilities and other essential services would increase, adding to inflationary pressures and creating additional urbanisation challenges.
Addressing insecurity in farming communities, he said, was important not only for protecting lives and property and boosting agricultural output but also for easing cost pressures in urban centres, adding that the June CPI data reinforced the view that Nigeria’s inflation challenge is predominantly structural rather than monetary.
On the monetary policy outlook, he said the data do not justify further monetary tightening, arguing that headline inflation has largely stabilised.
The CPPE chief expected the Monetary Policy Committee (MPC) to retain the current monetary policy rate at its next meeting, adding that the priority is for monetary and fiscal authorities to work together to accelerate structural reforms to expand food supply, improve logistics, reduce energy and production costs, lower debt service costs, as well as strengthen domestic value chains.

By Aduragbemi Omiyale
Additional shares of Sterling Financial Holdings Company Plc have been listed on the Nigerian Exchange (NGX) Limited.
The new equities were added to the company’s existing stocks on Customs Street on Thursday, July 16, 2026, a notice from the bourse confirmed.
Business Post reports the total new ordinary shares of Sterling Holdings listed yesterday were 13,812,239,000 units.
They were from the offer for subscription of 12,581,000,000 ordinary shares of 50 Kobo each sold for N7.00 per share, which was oversubscribed by investors.
The financial institution brought the new shares to the stock exchange to increase its total issued and fully paid-up shares to 65,929,251,414 ordinary shares of 50 Kobo each from 52,117,012,414 ordinary shares of 50 Kobo each.
“Trading licence holders are hereby notified that an additional 13,812,239,000 ordinary shares of 50 Kobo each of Sterling Financial Holdings Company Plc were on Thursday, July 16, 2026, listed on the daily official list of Nigerian Exchange Limited.
“The additional shares listed on NGX arose from the company’s offer for subscription of 12,581,000,000 ordinary shares of 50 Kobo each at N7.00 per share.
“With the listing of the additional shares, the total issued and fully paid-up shares of Sterling Financial Holdings Company Plc have now increased from 52,117,012,414 to 65,929,251,414 ordinary shares of 50 Kobo each,” the notice read.
By Adedapo Adesanya
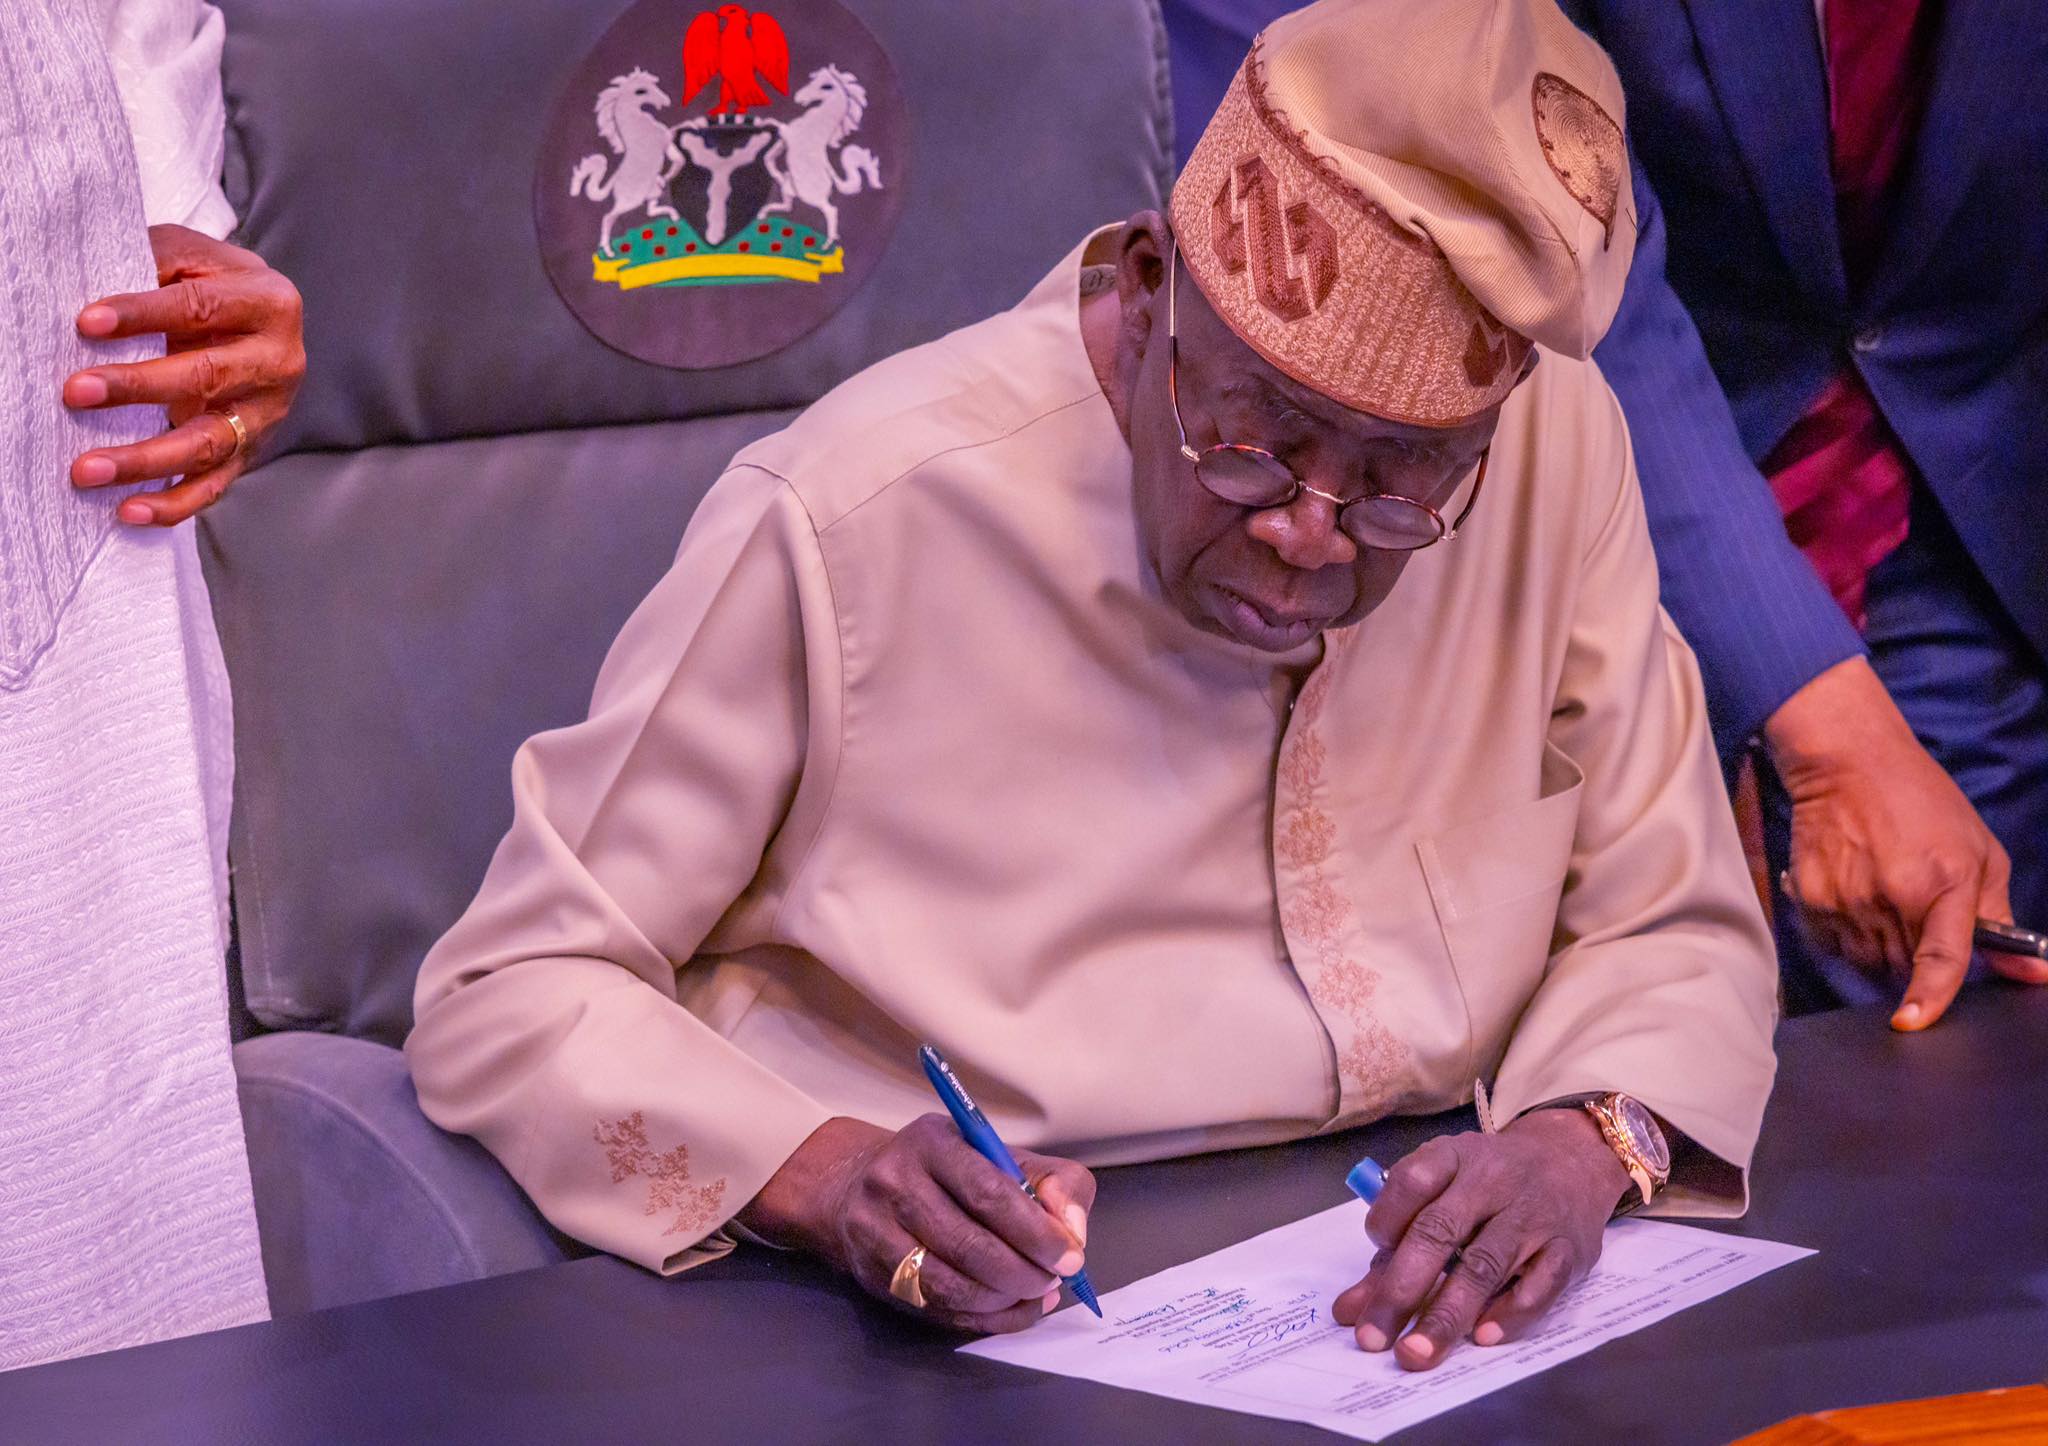
President Bola Tinubu has signed a Presidential Executive Order on Virtual Assets Coordination, establishing a new framework to coordinate the regulation of virtual assets across government agencies as Nigeria seeks to curb fraud while supporting innovation in the digital economy.
The Executive Order, which takes immediate effect, creates a Virtual Asset Council chaired by the Central Bank of Nigeria (CBN) to harmonise oversight of cryptocurrencies, tokenised assets, stablecoins, and other digital assets without creating a new regulator.
As part of the new framework, the CBN will establish a regulatory sandbox that will allow eligible firms to test virtual asset products, blockchain solutions, and related services under regulatory supervision before they are introduced to the wider market.
The development was disclosed in a statement issued on Friday by the President’s Special Adviser on Information and Strategy, Mr Bayo Onanuga.
According to the presidency, the Executive Order responds to the growing complexity of virtual assets, which increasingly cut across the traditional boundaries of currencies, securities, commodities, and payment systems.
The fragmented regulatory environment has left gaps that have exposed Nigeria to money laundering, terrorism financing, cybersecurity and data privacy risks, fraud, and revenue losses.
The government said some unregistered operators have exploited these regulatory gaps to defraud unsuspecting Nigerians, resulting in significant financial losses.
“The Order is designed to close these gaps through supervisory coordination, without introducing new layers of regulation or displacing the mandates of existing agencies,” the statement read.
Under the new framework, the Virtual Asset Council will be chaired by the CBN, with the Nigeria Revenue Service (NRS) and the Securities and Exchange Commission (SEC) serving as vice chairs. Other members include the Nigerian Financial Intelligence Unit (NFIU) and the Office of the National Security Adviser (ONSA).
The Council will provide policy direction, improve cooperation among participating agencies, and work with the Attorney General of the Federation to develop a harmonised legal and institutional framework for the sector.
The Executive Order also establishes a Virtual Asset Office, which will serve as the Council’s operational arm. The office will be domiciled at the CBN and will coordinate information sharing, applications, and reporting among the participating agencies through a shared supervisory technology platform.
The presidency stressed that the Executive Order does not create a new regulator or transfer statutory powers from existing agencies, clarifying that instead, each institution will continue to exercise its existing mandate while working within a coordinated framework.
Under the arrangement, registration of virtual asset businesses will depend on the nature of the service being offered.
Activities classified as securities will continue to be regulated by the SEC, while payment, settlement, custody, and other services involving non-security virtual assets will fall under the CBN.
Where there is uncertainty over regulatory jurisdiction, the Virtual Asset Council will determine the appropriate supervising agency.
“The sandbox will provide a controlled environment in which eligible operators can test and operate virtual asset products, services, and blockchain-based solutions under close supervision, enabling the participating agencies to assess the implications for monetary sovereignty, financial stability, market integrity, consumer protection, financial inclusion, and revenue administration before products reach the wider market,” the statement added.
According to the presidency, the sandbox will enable regulators to evaluate the implications of emerging products for financial stability, monetary sovereignty, consumer protection, financial inclusion, market integrity, and revenue administration.
The central bank is expected to announce further details of the sandbox.
