Economy
The World’s Top 10 Economies

The inequitable distribution of income is present at the global level where the nominal gross domestic product (GDP) of the top 10 economies adds up to over 66% of the world’s economy, and the top 15 economies add up to over 75%. The remaining 172 countries constitute only 25% of the world’s economy.
Here’s the list of the top 10 economies based on the criteria of GDP, current prices (US dollars) which is simply known as nominal GDP. The rankings differ if the same list is prepared using the GDP based on purchasing-power-parity (PPP).
As a general rule, developed countries have a smaller gap between their nominal GDP (i.e., current prices) and GDP based on PPP.
The difference is greater in developing countries, which tend to have a higher GDP when valued on purchasing-power-parity basis. This list is based on IMF data, which is updated twice annually.
This list was compiled by Investopedia and last updated on July 18, 2016.
- United States
The U.S. economy is the largest in the world in terms of nominal GDP (measured at current prices in US dollars). The $17.95 trillion US economy is approximately 24.5% of the gross world product. The United States is an economic superpower that is highly advanced in terms of technology and infrastructure and has abundant natural resources. However, the U.S. economy loses its spot as the number one economy by a slight margin to China when measured in terms of GDP based on PPP. In these terms, China’s GDP is $19.4 trillion and the U.S. GDP is $17.95 trillion. However, the U.S. is way ahead of China in terms of GDP per capita (PPP) – approximately $55,805 in the U.S. versus $14,107 in China.
- China
China has transformed itself from a centrally planned closed economy in the 1970’s to a manufacturing and exporting hub over the years. The Chinese economy is propelled by an equal contribution from manufacturing and services (45% each, approximately) with a 10% contribution by the agricultural sector. The Chinese economy overtook the U.S. economy in terms of GDP based on PPP. However, the difference between the economies in terms of nominal GDP remains large. China is currently a $10.98 trillion economy and has been growing at around 7% in the recent years, although that growth is starting to slow down.
- Japan
Japan’s economy ranks third in terms of nominal GDP, while it slips to fourth spot when comparing the GDP by purchasing-power-parity. The economy has been facing hard times since 2008, when it was first showed recessionary symptoms. Though the government’s stimulus packages have helped the economy recover a bit, the massive earthquake in 2011 gave the fragile economy another jolt. Economic growth has hovered between 0.5–2% in recent times, but is forecasted to stay below 1% during the next six years. The nominal GDP of Japan is $4.12 trillion, its GDP (PPP) is $4.83 trillion, and its GDP (PPP) per capita is $38,054.
- Germany
Germany is Europe’s largest and strongest economy. On the world scale, it ranks as the fourth largest economy in terms of nominal GDP. Germany’s economy is known for its exports of machinery, vehicles, household equipment, and chemicals. Germany has a skilled labor force, but the economy faces demographic challenges like most European nations. The size of its nominal GDP is $3.36 trillion, while its GDP in terms of purchasing-power-parity is $3.84 trillion. Germany’s GDP (PPP) per capita is $46,893, and the economy has moved at a moderate pace of 1-2% in recent years and is forecasted to stay that way.
- United Kingdom
The United Kingdom, with a $2.85 trillion GDP, is the world’s fifth largest. The economy of the UK is primarily driven by services, as the sector contributes more than 75% of the GDP. With agriculture contributing a minimal 1%, manufacturing is the second most important contributor to GDP. Although agriculture is not a major contributor to GDP, 60% of its food needs is produced domestically, even though less than 2% of its labor force is employed in the sector. After the referendum in June 2016 when voters decided to leave the European Union, economic prospects for the UK are highly uncertain, and the UK and France may swap places. The country will operate under EU regulations and trade agreements for two years after the formal announcement of an exit to the European Council, in which time officials will work on a new trade agreement. Economists have estimated that a Brexit could result in a loss of anywhere from 2.2-9.5% of GDP, depending on the trade agreements replacing the current single market structure.
- France
France, the most visited country in the world, is the sixth largest economy with a nominal GDP of $2.42 trillion. Its GDP in terms of PPP is around $2.65 trillion. France has a low poverty rate and high standard of living, which is reflected in its GDP (PPP) per capita of $41,180. The country is among the top exporters and importers in the world. France has experienced a slowdown over the past few years and the government is under immense pressure to rekindle the economy, as well as combat high unemployment which reached 10.35% in 2015. According to IMF forecasts the country’s GDP growth rate is expected to rise over the next six years, and unemployment is expected to go down.
- India
India ranks third in GDP in terms of purchasing-power-parity ($7.97 trillion), while its nominal GDP ($2.09 trillion) puts it in a seventh place. The country’s high population drags its GDP (PPP) per capita down to $6,162. India’s GDP is still dependent on agriculture (17%), compared to western countries. However, the services sector has picked up in recent years and now accounts for 57% of the GDP, while industry contributes 26%. The economy’s strength lies in a limited dependence on exports, high saving rates, favourable demographics, and a rising middle class. India recently overtook China as the fastest growing large economy.
- Italy
Italy’s $1.16 trillion economy is the world’s eighth largest in terms of nominal GDP. Italy is among the prominent economies of the eurozone, but it has been impacted by the debt crisis in the region. The economy suffers from a huge public debt estimated to be about 135.8% of GDP, and its banking system is close to a collapse and in need of a bail-out/bail-in. The economy is also facing high unemployment, but saw a positive economic growth in 2015 for the first time since 2011. The government is working on various measures to boost the economy that has contracted in recent years. The GDP measured in purchasing-power-parity for the economy is estimated at $2.17 trillion, while its per capita GDP (PPP) is $35,708.
- Brazil
Brazil with its $1.77 trillion economy, it is the ninth largest economy by nominal GDP. The Brazilian economy has developed services, manufacturing, and agricultural sectors with each sector contributing around 68%, 26%, and 6% respectively. Brazil is one of the BRIC countries, and was projected to continue to be one of the fastest growing economies in the world. However, the recession in 2015 caused Brazil to go from seventh to ninth place in the world economies ranking, with a negative growth rate of 3.8%. The IMF does not expect positive growth until 2018, and the unemployment rate is expected to grow over 3% – to 10.4% – over the same time period. The Brazilian GDP measured in purchasing-power-parity is $3.19 trillion, while its GDP per capita (PPP) is $15,614.
- Canada
Canada pushed Russia off the list with a nominal GDP of $1.55 trillion. Canada has a highly service oriented economy, and has had solid growth in manufacturing as well as in the oil and petroleum sector since the Second World War. However, the country is very exposed to commodity prices, and the drop in oil prices kept the economy from growing more than 1.2% in 2015 (down from 2.5% the previous year). The GDP measured in purchasing-power parity is $1.6 trillion, and the GDP per capita (PPP) is $45,553.
The Bottom Line
Some other economies that are a part of the “trillion-dollar” club and have the potential to make it to the top 10 going ahead are South Korea ($1.38 trillion), Russia ($1.32 trillion), Australia ($1.22 trillion), Spain ($1.2 trillion), and Mexico ($1.14 trillion).
Source: Investopedia
Economy
Katsina Provides Additional N500m for Women-owned Businesses
By Modupe Gbadeyanka
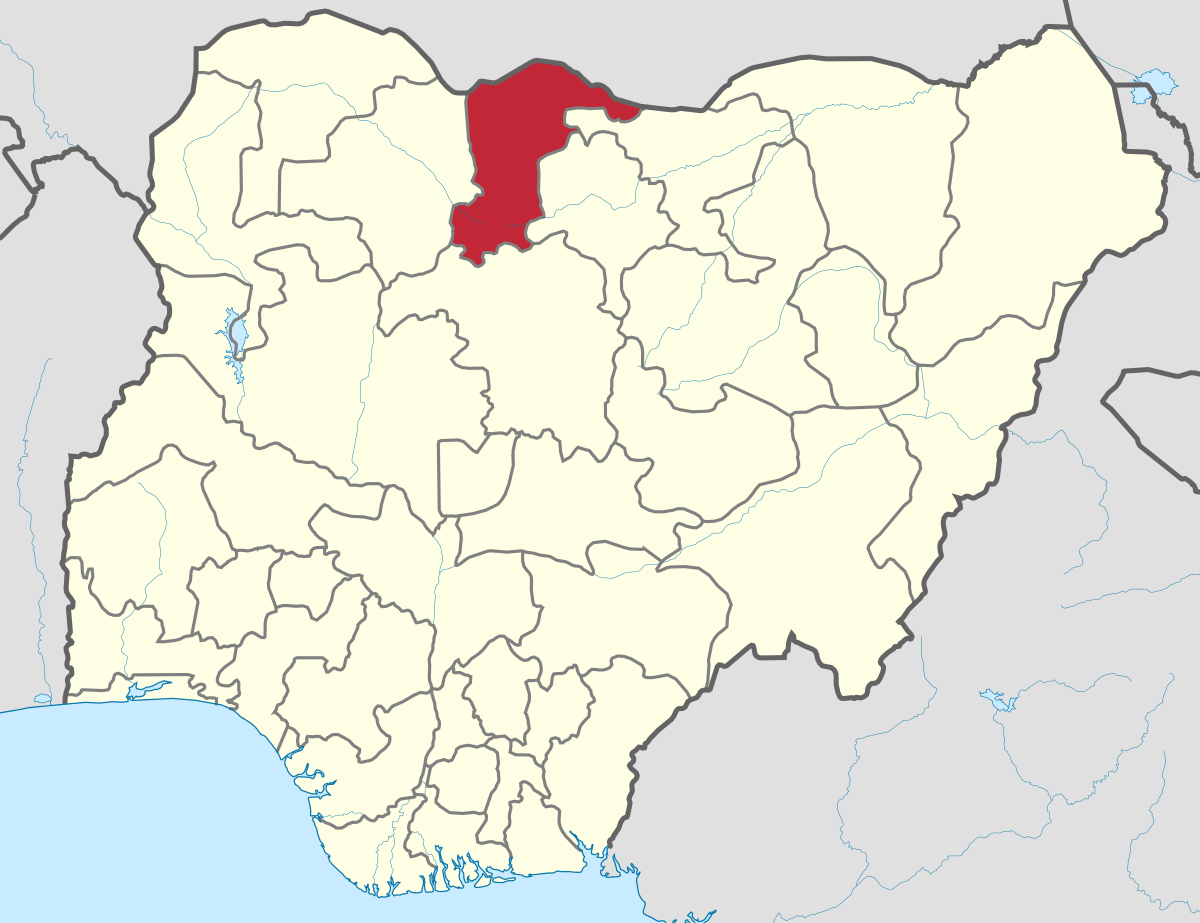
The Katsina State government has offered additional N500 million to support women-owned businesses in the state as part of efforts to boost economic activities.
Governor Dikko Umaru Radda announced this at the Women of Influence and Investment Summit hosted by the Katsina Inner Wheel Development Initiative (KIWDI), in partnership with Access Bank Plc.
The event brought together women entrepreneurs, investors, policymakers, and development partners to advance women’s economic empowerment in the state.
The summit, themed Where Influence Meets Investment, focused on positioning women as key drivers of enterprise, leadership, and inclusive growth. It also highlighted the growing collaboration between Access Bank and the Katsina State Government on financial inclusion and SME development.
Mr Radda noted that investing in women was critical to building a productive and sustainable economy.
In her welcome address, the founder of KIWDI, Ms Amina Zayyana, said the summit was designed to connect women to opportunities, training, finance, and markets, stressing that when women-led businesses grow, families and communities benefit.
On her part, the Group Head of Women Banking at Access Bank, Mrs Nene Kunle-Ogunlusi, said the lender was proud to partner with Katsina State and KIWDI in advancing women’s economic participation.
“At Access Bank, we are committed to moving women from potential to prosperity. Through our Women Banking proposition and the ‘W’ Initiative, we provide access to finance, capacity building, and market linkages that help women start, stabilise, and scale their businesses,” she said.
She noted that the W Initiative, launched in 2014, is Access Bank’s flagship women- focused platform, designed to meet the real needs of women entrepreneurs and professionals across Nigeria and Africa.
“Our partnership with Katsina State goes beyond banking. It is about supporting economic empowerment, SME growth, and financial inclusion, especially for women,” she added.
Mrs Kunle-Ogunlusi noted that Access Bank was proud to participate not just as a financial institution, but as a long-term partner in women’s economic advancement across Nigeria and Africa.
“At Access Bank, we made a deliberate decision to change that, not with charity, but with strategy. Not with sympathy, but with solutions. The W Initiative, which was launched in 2014, is Access Bank’s flagship women-focused proposition, created to respond to the real needs of women,” she said.
The banker disclosed that through the W Initiative, the bank has disbursed over N314 billion in loans to women, supporting over 3.6 million female loan beneficiaries, and helping women-owned businesses start, stabilise, and scale up.
Economy
2026 Budget: Reps Threaten Zero Allocation for SON, NAICOM, CAC, Others

By Adedapo Adesanya
The House of Representatives Public Accounts Committee (PAC) has recommended zero allocation for the Standards Organisation of Nigeria (SON), the National Insurance Commission (NAICOM), and the Corporate Affairs Commission (CAC), among others, in the 2026 budget for allegedly failing to account for public funds appropriated to them.
The committee, at an investigative hearing, accused the affected ministries, departments and agencies (MDAs) of shunning invitations to respond to audit queries contained in the Auditor-General for the Federation’s annual reports for 2020, 2021 and 2022.
The affected MDAs include the Federal Housing Authority (FHA), the Federal Ministry of Housing and Urban Development, the Federal Ministry of Women Affairs and Social Development, the National Business and Technical Examinations Board (NABTEB), and the Nigerian Meteorological Agency (NiMet).
Others are Federal University of Gashua; Federal Polytechnic, Ede; Federal Polytechnic, Offa; Federal Medical Centre, Owerri; Federal Medical Centre, Makurdi; Federal Medical Centre, Bida; Federal Medical Centre, Birnin Kebbi; Federal Medical Centre, Katsina; Federal Government College, Kwali; Federal Government Boys’ College, Garki, Abuja; Federal Government College, Rubochi; Federal College of Land Resources Technology, Owerri; Council for the Regulation of Freight Forwarding in Nigeria; and the FCT Secondary Education Board.
The PAC chairman, Mr Bamidele Salam, while speaking on the decision of the committee to recommend a zero budget for the defaulting MDAs, stated that the National Assembly should not continue to appropriate public funds to institutions that disregard accountability mechanisms.
“Public funds are held in trust for the Nigerian people. Any agency that fails to account for previous allocations, refuses to submit audited accounts, or ignores legislative summons cannot, in good conscience, expect fresh budgetary provisions. Accountability is not optional; it is a constitutional obligation,” he said.
The panel maintained that its recommendation for a zero budget for the affected MDAs is aimed at restoring fiscal discipline and strengthening transparency across federal institutions and conforms with extant financial regulations and the oversight powers of the parliament.
Economy
SEC, NOA to Sensitize Nigerians to Illegal Investment Schemes

By Adedapo Adesanya
The Securities and Exchange Commission (SEC) and the National Orientation Agency (NOA) have partnered to enlighten Nigerians on illegal investment schemes in Nigeria.
The director-general of SEC, Mr Emomotimi Agama, stated this during a meeting with his NOA counterpart, Mr Lanre Issa-Onilu, in Abuja on Thursday, according to a statement from SEC.
Mr Agama said the capital market is an available tool for national development, but beyond all that, there is a tendency for people to do the wrong things that will lead to the impoverishment of Nigerians.
According to him, these are not supposed to be, but many people fall victim due to a lack of knowledge. He stated that these schemes are springing up daily, and those involved are defrauding Nigerians, as people are always gullible because of the need to survive.
“As a management, we decided to move out to enlighten people; we cannot assume that people know, we need to go out for mass communication, hence this collaboration. It is only by co-operation that we can achieve the purpose of our existence,” he stated.
The SEC DG solicited the co-operation of the NOA to reach Nigerians because of its capacity and vast network of mass media, in a bid to ensure that the message reaches every nook and cranny of the country.
“This collaboration is important because it will go a long way in ensuring that Nigerians are no longer victims of these fraudulent schemes. We appreciate that you value this country, and we value the work that you do,” he added.
On his part, Mr Issa-Onilu commended the SEC for the capital market’s achievements in recent times, adding that the commission has not been celebrated enough.
“We commend you and thank you on behalf of the country, but most Nigerians are not aware of the opportunities in the capital market. An ignorant society will fall victim to many things that are avoidable. It is our responsibility to enlighten people to make the right decisions.
“We request that you provide information on what you do to enable us to propagate them. Our primary assignment is to serve all government institutions as the communications arm. We do a lot of enlightenment in places like the religious houses, motor parks, town halls, among others.”
Mr Issa-Onilu said the NOA engages in civic education to create the right values that will help most Nigerians be better citizens, saying that “many Nigerians are deficient in good behaviour. Both the Ponzi scheme promoters and those who patronise them are suffering from the wrong attitude and values.
“We have to encourage people to have the right attitude so they do not fall victim to Ponzi schemes. We have created a lot of platforms to interact with Nigerians.”
-

 Feature/OPED6 years ago
Davos was Different this year
-
Travel/Tourism10 years ago
Lagos Seals Western Lodge Hotel In Ikorodu
-

 Showbiz3 years ago
Estranged Lover Releases Videos of Empress Njamah Bathing
-

 Banking8 years ago
Sort Codes of GTBank Branches in Nigeria
-

 Economy3 years ago
Subsidy Removal: CNG at N130 Per Litre Cheaper Than Petrol—IPMAN
-

 Banking3 years ago
Sort Codes of UBA Branches in Nigeria
-

 Banking3 years ago
First Bank Announces Planned Downtime
-

 Sports3 years ago
Highest Paid Nigerian Footballer – How Much Do Nigerian Footballers Earn


