
Feature/OPED
7 Top Financial Indicators You Should Monitor as a Business Owner

By Olutomi Rone
Business owners must track and monitor financial indicators to analyse their businesses’ performance. However, financial indicators necessary for monitoring performance are by no means generic, not to businesses of a similar size, not to businesses within the same country, not to companies within the same sector or industries, and alarmingly not even to departments within the same business.
The finance function within businesses must be ready to craft the right strategy for the customised design and implementation of the right metrics. But too often, it has been perceived to be a non-revenue generating, number crunching and tunnel vision function. Yet, the finance function is one of the most strategic functions of an organisation.
According to a survey of more than 500 finance professionals in the UK by webexpenses, 60% of the finance professionals felt undervalued within their organisation. About 53% felt they did not get the same respect as colleagues working in other departments.
The secret to extracting the finance function’s strategic value is offering them a seat at the table; else, the finance function is incapable of creating and maximising stakeholders’ return.
With my years of experience in metric design and implementation across businesses with different compositions and in various sectors, I will recommend using the following indicators in addition to more customised metrics.
However, the finance function should consider details like the business model, size, equity composition, PPE investments, manufacturing, and capital structure during the design phase. These top financial indicators should be designed to cover Profitability, Liquidity, Solvency, Gearing, Valuation, and Investments of the business.
Here are the 7 top financial indicators you should monitor on your periodic dashboard as a business owner.
Net Profit Margin
The majority of organisations commonly overlook this primary financial indicator; yet, one of Harvard Business School’s articles on 13 financial measures to monitor highlighted net profit margin as a critical financial metric for any organisation.
This profitability indicator measures the actual percentage of net profit an organisation earns directly related to its total revenue and is calculated by dividing net profit by the revenue in any one period. The higher the percentage of this net profit margin, the better the organisation is deemed to have performed.
High net profit margins mean the organisation has a good pricing strategy and/or operating solid cost optimisation initiatives. However, a heavily geared and capital intensive (PPE heavy) organisation could distort the net profit margin by presenting a lower net profit margin.
Gross Profit Margin
This financial indicator focuses on the direct cost or cost of goods sold and how much of this cost line is used to generate revenue for the organisation. This metric is a fundamental indicator for manufacturing companies as they tend to have higher direct costs than firms whose solutions are more service-oriented.
This profitability indicator is calculated by dividing the gross profit by the organisation’s revenue. Like the net profit margin, it should be compared with ratios from previous periods for the same firm and with other firms within the same sector. A high gross profit margin means the company is efficient in using its resources to produce goods/services.
Cash Flow to Revenue
This ratio is essential for keeping close tabs on cash generation compared to revenue generation; it provides a clear insight into how well the business collects its cash. While companies in the hospitality or aviation space might not have their cash tied down, those in the consulting or telecom infrastructure sector may have another story to tell.
The ratio is calculated by dividing the organisations operating cash flow by its net revenue. For a healthy organisation, we expect a ratio of at least one, a ratio below this could mean an ineffective cash collection system within the organisation.
Quick Ratio
This liquidity ratio measures an organisation’s ability to pay off its liabilities in the shortest possible time frame. It is calculated by deducting inventory and prepaid expenses from current assets and dividing the resulting figure by current liabilities; the ideal quick ratio is one or above.
It evaluates the current assets of an organisation. It allows the user to conduct a scenario analysis that considers what would happen to the organisation should it need to pay off its short term liabilities “quickly”.
In a US study of why businesses fail, 82% of failed businesses experienced cash flow issues; I believe a sizeable proportion of these companies could not promptly convert some assets to cash.
Debt to Equity
This ratio indicates solvency and financial leverage; it examines the organisation’s capital structure and seeks to highlight any over-reliance on debt or equity. The ratio is calculated by dividing total long-term debt by shareholders equity. It shows debt as a ratio of total equity; a ratio of one or higher is considered less risky.
When using this ratio to make comparisons, do so with organisations within the same sector because specific sectors have a higher appetite for debt than others. A caveat is that debt is not always bad for business; it can be used to fund feasible and well-thought-through growth strategies without affecting the structure of shareholders equity.
Price/Earnings (P/E) Ratio
This valuation indicator is a robust measure of the alignment between an organisation’s share price and earnings per share. The ratio is calculated by dividing price per share by earnings per share ((net income – preference dividends)/weighted average of ordinary shares outstanding).
The P/E ratio should always be compared to sector averages. P/E ratios higher than sector average are often perceived as overvalued and risky, while shares with lower than average P/E ratios are often perceived as future moneymakers and allows the investor to benefit from share price increases.
Moreover, consider consulting an industry expert or a professional valuation firm if you need a business valuation. Doing so will give you access to expert knowledge and the necessary tools to accurately assess the value of your business and ensure that you make informed decisions regarding its growth and profitability.
Return On Capital Employed (ROCE)
This is a profitability/investment ratio, and it is often used as a decision-making metric for investment purposes like the P/E ratio. It is calculated by dividing earnings before interest and tax by capital employed (this represents the total amount invested in the organisation).
The metric tells investors how efficiently capital is being used to generate profit. It should be compared to historical figures of the same organisation to establish a pattern for capital utilisation.
All the metrics mentioned above must be interpreted together, meaning that a single promising metric should not be used as a sole positive indicator for your business.
It is important for business owners to have the right set of financial indicators that cover all the critical business sustainability areas. It sets the right accountability tone for the individuals tasked with revenue generation responsibility, small business expense report, and provides a clear target-setting basis for monitoring and performance evaluation.
With these metrics incorporated into periodic management review meetings, business owners can worry less, knowing there is a robust system in place that would identify any potential sustainability or going-concern issues before they are likely to occur.
Olutomi Rone is a director at African Ally, a global staffing solutions company. She started her career in the UK within the banking, consulting and manufacturing sectors. In Nigeria, she has worked in the consulting sector at PwC and was the Head of Business Planning at IHS, she then moved on to be the Chief Operating Officer at Kimberly Ryan Limited.
She holds a BA(ECON) Honors from the University of Manchester, UK and is ACCA qualified. She is a cross-functional leader with 19 years of experience in Business Planning and Analysis, Strategy Formulation, IPO Readiness, HR, Finance and Accounting. Her experience cuts across Finance, HR Consulting, Telecommunications, Manufacturing and Construction Industries.
By Blaise Udunze
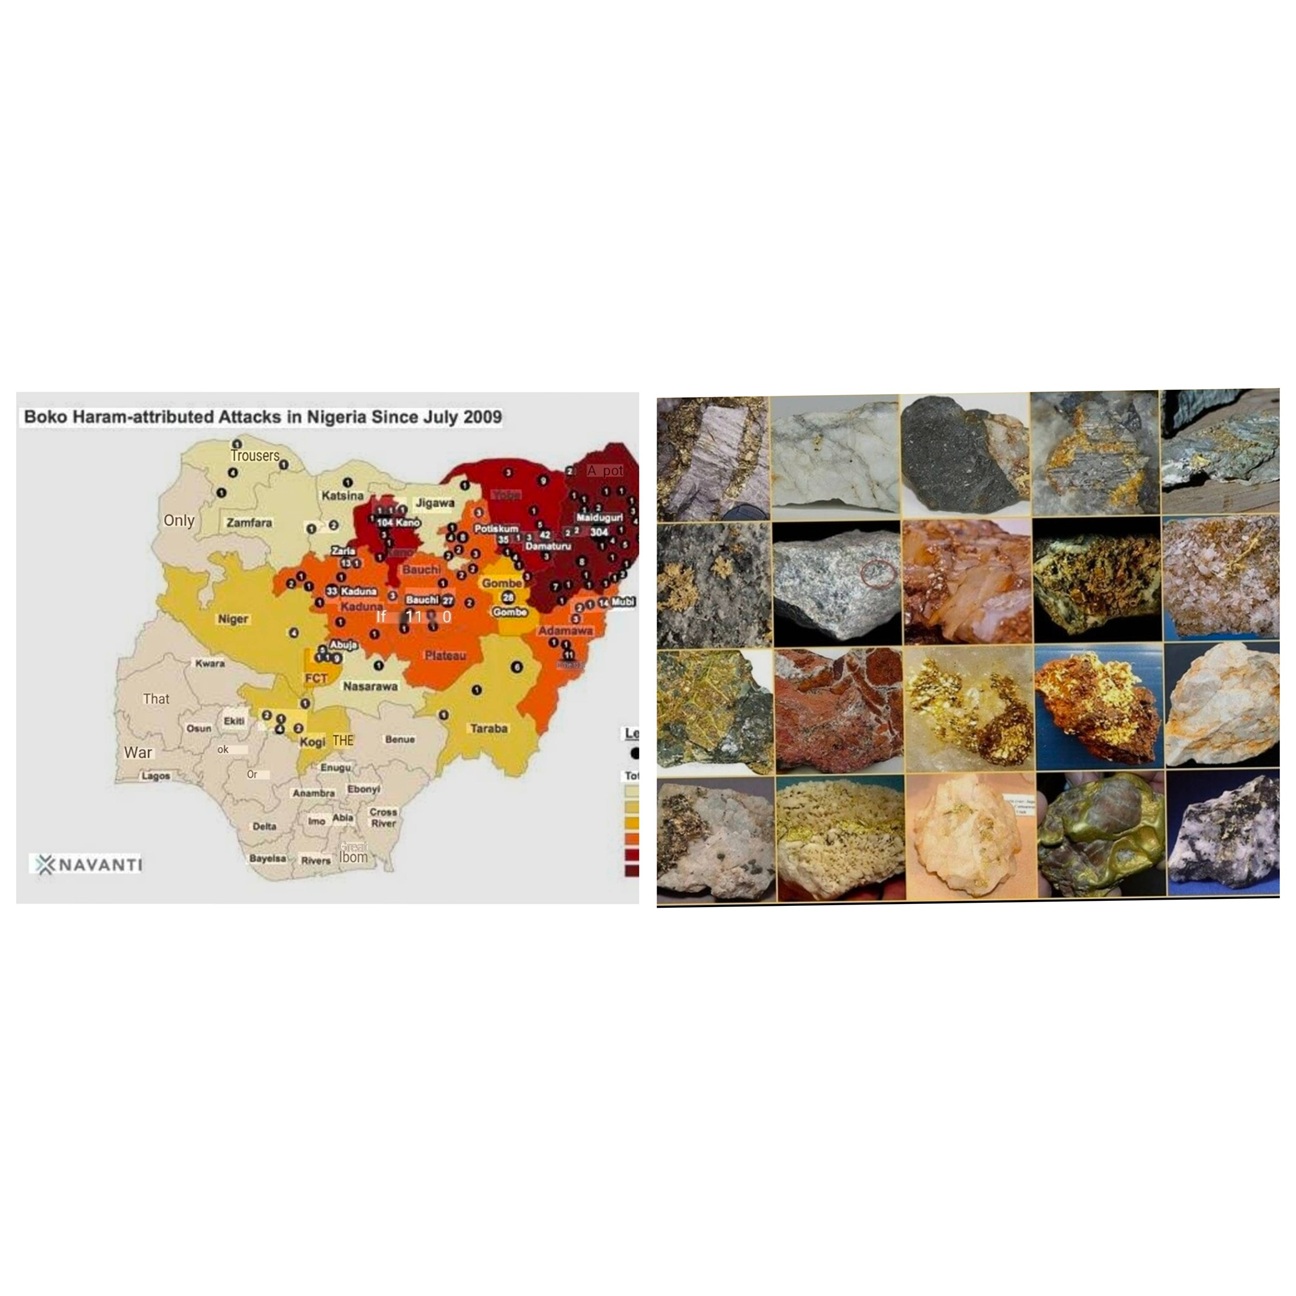
Daily, the world watches Nigeria through a familiar lens in what appears to be a gory situation. Especially in cases when the news headlines tell stories of farmer-herder clashes, bandit attacks, kidnappings, villages reduced to ashes or deserted by the dwellers, as thousands of Nigerians have been displaced across states such as Zamfara, Plateau, Benue, Niger, Kaduna and Nasarawa. Subliminally, this is about to become a similarly ugly occurrence in southwestern Nigeria, which is fast becoming obvious if not nipped in the bud quickly.
Recorded data have shown that bandits, Boko Haram, and others killed over 190,000 Nigerians in 17 years and displaced 3.7 million people.
A human rights organisation, the International Society for Civil Liberties and Rule of Law (Intersociety), in its fearful revelation, has said that no fewer than 190,150 Nigerians have been killed by bandits, Boko Haram insurgents, and suspected armed herdsmen between July 2009 and March 19, 2026, as this calls for concern.
The dominant explanations often point to ethnic tensions, religious divisions, climate change, shrinking grazing routes or weak security institutions. No doubt, those factors are certainly part of Nigeria’s complex security crisis. Yet another question deserves serious examination.
What if, in some locations, the violence is also serving another purpose? What if some of the territories experiencing repeated displacement are the same places sitting atop some of Nigeria’s most valuable mineral deposits? More importantly, if such a pattern exists, who benefits when communities disappear?
Of a truth, these questions are uncomfortable, but undeniably they deserve careful investigation rather than dismissal.
For ages, Nigeria has been naturally endowed, and it is estimated to be rich in enormous significant reserves of gold, lithium, uranium, tin, columbite and other strategic minerals increasingly sought after in the global transition to clean energy technologies. As international demand for battery minerals continues to rise, these resources have become far more valuable than they were only a decade ago.
If one overlays publicly available geological information with maps showing persistent violence, some observers argue that striking geographical overlaps appear in several regions. Such overlaps alone cannot establish causation. Correlation is not proof of conspiracy. However, they raise questions worthy of independent scrutiny.
One issue attracting increasing attention and adequately yearns for answer is whether prolonged insecurity may inadvertently or deliberately create conditions that make mineral extraction easier.
Under Nigeria’s Nigerian Minerals and Mining Act 2007, mineral resources belong to the Federal Government, while mining rights are granted through licences and leases. Community engagement and land access are expected to form part of the licensing process, although implementation varies depending on circumstances. This raises an important policy question.
What happens when the communities expected to participate in those processes have already fled because of violence?
Displacement changes the dynamics of land ownership, consent and access. While no evidence automatically proves that attacks are orchestrated to facilitate mining, the sequence of violence followed by renewed commercial activity in some locations deserves closer examination by regulators, lawmakers and investigative journalists.
In conflict studies, researchers have long observed that wars often generate economic winners alongside humanitarian losers. Could elements of Nigeria’s insecurity also be producing economic beneficiaries?
Reports over the years have documented concerns about illegal mining operations across parts of northern Nigeria. Government agencies themselves have repeatedly acknowledged that criminal networks profit from the country’s vast mineral wealth. The unresolved question is whether isolated criminality has, in some instances, evolved into more sophisticated alliances involving political influence, financial interests and international supply chains. If so, the implications extend far beyond Nigeria.
Invariably, it is clearly known that lithium has become one of the world’s most strategic commodities, powering electric vehicle batteries and renewable energy storage systems. Gold has always remained one of the safest global investment assets during periods of uncertainty. Meanwhile, it is well confirmed that the global appetite for these minerals creates enormous financial incentives.
Suppose violent displacement reduces resistance to extraction. Suppose shell companies subsequently acquire mining interests. Suppose minerals then leave Nigeria through legitimate-looking export documentation while their true value remains understated.
These scenarios remain allegations unless supported by verifiable evidence. Yet they outline a framework that investigators may wish to test rather than ignore. Financial crime experts frequently identify trade mis-invoicing as one of the most common methods of illicit financial flows worldwide.
Could Nigeria’s solid minerals sector be vulnerable to similar practices? If valuable lithium ore is deliberately but inaccurately described as lower-value material on export documents, substantial wealth could potentially leave the country without reflecting its true market value. Likewise, if unrefined gold exits through privileged channels with limited scrutiny, questions naturally arise about oversight, transparency and accountability over criminal activities which have continued to stunt and disrupt the country’s socio-economic growth and at the same time cause carnage.
Such possibilities are not accusations against any particular institution or company. Rather, they illustrate why stronger monitoring systems are increasingly essential. Another question concerns logistics.
With the high level of criminal activities, industrial mining requires heavy machinery, diesel supplies, transportation networks and specialised personnel. These are not operations that can remain invisible indefinitely.
If certain territories are genuinely too dangerous for security agencies, how do industrial-scale extraction activities reportedly continue in some remote locations? If they do, who protects those operations? Who authorises their movement? Who verifies what is extracted? Who ensures royalties and export revenues reach public coffers? These are governance questions that demand institutional answers.
Equally important is the international dimension. Minerals extracted in Nigeria ultimately enter global supply chains. Gold may pass through international refining hubs before entering financial markets. Lithium may become part of battery manufacturing destined for electric vehicles, which are being sold across Europe, North America and Asia.
One known fact is that consumers purchasing products containing these minerals rarely know the full story of where they originated.
Increasingly, however, investors and governments are demanding ethical sourcing standards that trace minerals from extraction to final manufacture.
A critical factor that must be taken into cognisance is that if insecurity is creating opportunities for illegal or unethical extraction anywhere in the world, multinational companies have responsibilities alongside national governments, of which the onus falls on the Nigerian government.
Transparency cannot stop at the mine gate. Nor should accountability end at national borders. Another issue requiring attention concerns beneficial ownership.
Across many jurisdictions, shell companies can obscure the identities of individuals ultimately controlling commercial assets. If politically exposed persons or powerful business interests are hidden behind complex corporate structures registered offshore, identifying beneficiaries becomes significantly more difficult. This challenge is hardly unique to Nigeria.
Findings showed that from Latin America to Central Africa and Southeast Asia, resistant corporate networks have frequently complicated efforts to combat corruption and illicit resource extraction. That is precisely why open corporate registries, beneficial ownership databases and transparent mining licence disclosures are becoming global governance priorities. For Nigeria, the stakes could hardly be higher.
The country stands at the centre of the world’s emerging critical minerals economy. The Nigerian government can’t feign ignorance of the fact that, when handled transparently, these resources could finance infrastructure, education, healthcare, and industrial development for generations.
In no way would the government claim not knowing that when handled poorly, they risk becoming another chapter in the well-documented “resource curse,” where extraordinary natural wealth coincides with persistent poverty, insecurity and institutional weakness.
The ultimate challenge, therefore, is not simply about mining. It is about governance. It is about whether public institutions possess both the independence and capacity to ensure that natural resources benefit citizens rather than narrow interests. It is about whether conflict zones receive genuine peacebuilding efforts instead of becoming forgotten frontiers. And it is about whether international markets demand accountability with the same enthusiasm they demand raw materials.
None of these questions should be answered through speculation. They require rigorous investigations, forensic financial analysis, satellite imagery, mining license audits, customs records, beneficial ownership disclosures and courageous journalism.
They require governments willing to open their books. They require international cooperation capable of tracing money across borders. Most importantly, they require asking questions that have too often remained unasked.
Perhaps Nigeria’s security crisis is exactly what it appears to be: a tragic convergence of historical grievances, weak institutions, criminality and environmental pressures. Or perhaps, in some places, another layer of economic incentive deserves closer scrutiny.
Until those questions are thoroughly investigated, one possibility will continue to linger. Maybe the world’s attention has been fixed on the blood spilt above ground, while too little attention has been paid to the extraordinary wealth lying beneath it.
Blaise, a journalist and PR professional, writes from Lagos and can be reached via: bl***********@***il.com
Feature/OPED
What Does Nigeria’s $51bn Reserves Milestone Mean if Most New Foreign Money Can Leave Quickly?

Nigeria’s foreign reserves have climbed to about $51 billion, a decade-plus high, according to the Central Bank of Nigeria (CBN). EBC Financial Group (EBC) notes that this reflects stronger investor confidence, but the second half may show whether it holds, as the build rests on three cyclical drivers: oil earnings, short-term foreign money and a narrowing official-to-street naira gap.
Reserves rose from about $32 billion in April 2024, during a dollar shortage, to about $51 billion now, near the CBN’s target. Much came from two cyclical sources, strong oil earnings and money chasing high-yielding naira assets, so EBC expects the pace to slow or reverse. Fitch Ratings, a major international credit rating agency, expects a marginal decline to about $47 billion by the end of 2026, citing higher spending and external pressures.
David Precious, Senior Market Analyst at EBC Financial Group, said, “Nigeria’s reserve build is real but may not be durable yet, because nearly all of the new money is the kind that can leave quickly. Of the $10.37 billion that came in over the first quarter, the overwhelming majority was short-term portfolio funds rather than long-term investment, so a shift in oil prices, global interest rates or confidence in the naira might pull a large part of it straight back out.”
Most New Money Can Still Leave Quickly
The composition of the foreign inflows explains the caution over how long the build can last. The country attracted $10.37 billion in foreign investment in the first quarter of 2026, up 83.83 per cent year-on-year, according to the National Bureau of Statistics (NBS). Of that, $9.86 billion or 95.09 per cent, was portfolio money, largely short-term naira debt such as Treasury bills that investors can sell at the next auction, while foreign direct investment, the long-term kind that builds factories and jobs, was $135.08 million, or 1.30 per cent. Put simply, of each dollar coming in, about 95 cents can leave quickly, and barely one cent stays.
That money supports reserves while it stays. Dollars brought in to buy naira assets add to market supply, letting the CBN hold more reserves and steady the naira. It leaves when conditions change. Nigeria earns most of its export dollars from oil and gas, so lower oil prices mean fewer dollars, and as a member of the Organisation of the Petroleum Exporting Countries (OPEC), it cannot simply produce more, output capped by quota and reduced by theft and ageing fields. Higher global interest rates draw money toward safer returns abroad, and a weakening naira prompts investors to sell early. When oil fell in 2016 and 2020, foreign investors withdrew and could not convert naira to dollars as supply dried up, leaving the CBN to clear more than $7 billion in trapped obligations into 2024.
The Oil Boost is No Longer Certain
Oil looked like a dependable source of the dollars behind the reserves only months ago. Earlier in 2026, concern over disruption around the Strait of Hormuz lifted crude prices, and stronger receipts flowed in, with crude oil export earnings of $8.11 billion in the first quarter in the CBN’s balance-of-payments data. That support is now easing. The tension has subsided, and Brent traded near $72 on June 29, down about 24 per cent over the month, back to pre-conflict levels. With the price boost gone and output constrained, reserves are more exposed, leaning on non-oil earnings and investor patience rather than oil.
The Naira Still Trades at Two Prices
The naira has traded at two prices, an official rate and a higher parallel-market rate, and closing that gap into one trusted price is what many investors might watch most. Before committing funds, they may want assurance they can convert naira to dollars at a fair rate when they exit, and a wide gap revives the fear of being trapped that lingers from earlier shortages. The gap has narrowed to roughly N20 to N30, with the CBN’s official rate near N1,380 per dollar on June 26 against parallel-market quotes around N1,400. The International Monetary Fund (IMF) 2026 Article IV review urged Nigeria to depend less on this fast-moving portfolio money and to keep phasing out its multiple exchange-rate practices. The CBN’s Foreign Exchange Manual, in force from 1 June, is intended to make the market clearer, though such rules build confidence only once investors can freely trade dollars at the posted rate.
What could Make the Build Durable
A few signs that may show the build turning durable include a smaller gap between the official and street naira rates, more long-term foreign investment, and steadier oil earnings. A gap that stays small, now roughly N20 to N30, may mean investors trust the official rate and no longer need the street market. A clear rise in foreign direct investment, only $135 million last quarter against $9.86 billion of short-term money, might mean lasting capital is replacing funds that can leave at the next auction. Oil earnings that hold up, rather than sliding from the low $70s, should help keep reserves steady, since oil and gas bring in most of Nigeria’s export dollars.
“Reserves built on money chasing high yields can fall as fast as they rose, as they did after the last two oil shocks, when investors left, and the CBN spent years clearing a foreign-exchange backlog,” Precious added. “What holds through a downturn is slower money, direct investment, steady oil and non-oil export earnings and one credible naira rate, and that is the shift Nigeria has yet to make.”
By Olajumoke Bello
Across Nigeria, small and medium enterprises remain the backbone of economic activity. They drive trade, create jobs, and sustain millions of livelihoods. Yet, despite their importance, many SMEs continue to operate below their full potential due to persistent structural challenges.
Access to finance remains one of the most cited constraints. However, the issue today goes beyond the availability of capital. Many businesses struggle with financial readiness, weak documentation, and limited understanding of what lenders require. This often leads to missed opportunities, even when funding options exist.
At the same time, SMEs face gaps in market access and visibility. Business owners operate in highly localised environments, with limited exposure to broader networks that can unlock partnerships, new markets, and growth opportunities. This isolation can constrain scalability and reduce long-term competitiveness.
Equally important is the capability gap. Many entrepreneurs grow through resilience and experience but lack structured knowledge on critical areas such as financial management, export readiness, and digital adoption. Without this, even well-capitalised businesses can struggle to sustain growth.
These challenges point to a clear need for a more practical and integrated approach to SME support. It is no longer sufficient to offer standalone solutions. SMEs require ecosystems that combine knowledge, access, and direct engagement in ways that reflect how they actually operate.
A key shift is the move from centralised interventions to localised engagement. SMEs are deeply influenced by their immediate environments, whether markets, industrial clusters, or trade corridors. Solutions must therefore be brought closer to where these businesses function, allowing for more relevant support and stronger relationships.
Another important shift is from awareness to action. Business owners do not only need information; they need insights that they can apply immediately. This includes understanding how to structure their finances, how to access trade opportunities, and how to connect with the right partners to scale their operations.
There is also a growing need for continuity. Many SME-focused initiatives deliver strong initial impact but lack follow-through. For support to be effective, it must extend beyond one-off engagements into sustained relationships, with clear pathways for onboarding, advisory, and growth.
For financial institutions, this presents both responsibility and an opportunity. Supporting SMEs now requires moving beyond transactional banking to deeper partnership models. It requires understanding businesses at a granular level and co-creating solutions that evolve with their needs.
At Stanbic IBTC, this perspective continues to shape our approach to SME development. Our focus is on delivering practical support that translates into real business outcomes, helping enterprises grow, compete, and contribute more meaningfully to the economy.
As part of this commitment, we are extending our SME engagement to the regions through the Nigeria Business Summit Regional Tour. The tour will take structured, on-ground activations into key commercial hubs, where SMEs can access funding guidance, trade insights, advisory support, and direct engagement with financial experts.
The regional tour will take place across five strategic locations, bringing these solutions closer to business owners in Aba, Onitsha, Ibadan and Kano.
This approach reflects an important principle. When support moves closer to businesses and when solutions are delivered in ways that are practical and continuous, SMEs are better positioned to grow sustainably. In turn, this strengthens not only individual enterprises but the broader economy.
Olajumoke Bello is the Head of Enterprise Banking at Stanbic IBTC Bank
