
Economy
Sub-Saharan Africa Yet to Return to Robust Growth Rates—Report

By Dipo Olowookere
Latest report from Nielsen Holdings Plc, a global performance management company providing a comprehensive understanding of what consumers Watch and Buy, has revealed that the Sub-Saharan Africa was yet to fully get back on its feet after going low in 2016.
Nielsen, in its 5th Nielsen Africa Prospects Indicator (APi) report, said the region was yet to uplift itself from the two-decade economic low reached last year, bringing a slight easing of pressure but certainly not a return to the robust growth rates previously experienced.
However, despite the turmoil and heavy constraints; it was emphasised that Africa’s ‘heavyweights’ namely Nigeria, Kenya and South Africa, cannot be ignored and remain a long-term priority for any business focused on Sub-Saharan Africa.
The latest report included a comparative ranking of eight African countries, drawn from multiple datasets, collected across the Macro Economic, Business, Consumer and Retail dimensions.
It was observed that manufacturers and retailers seeking to stay one step ahead in Africa’s complex markets needed to move beyond ‘business as usual’ – they simply cannot keep doing the same things and expecting a different result.
Commenting on the report, Nielsen Executive Director Thought Leadership Emerging Markets, Ailsa Wingfield, stated that, “No one size fits all and no total continent, country, city, consumer or channel approach is enough to ensure sustained success in Sub-Saharan Africa.
“Similarly, successful brands, advertising and activation in other developing markets do not provide the passport to growth in Africa’s complex markets and challenging climates.”
Challenging…but impossible to ignore
Considering this, it’s clear that the sub-continent’s two most significant economies, Nigeria and South Africa, are slowly turning around from recent declines to low levels of growth, however, the consolidated prospects for these two powerhouse economies continue to be subdued. Of the countries measured in Nielsen’s 5th Africa Prospects report, South Africa slips two positions to sixth place and Nigeria remains in eighth place.
South African consumers have expressed declining sentiment regarding their job prospects, personal finances and time to buy. With higher average GDP per capita – double that of Nigerians and Angolans and triple that of Kenyans – bigger in-store spend and an openness to new, innovative products, South Africa presents the strongest consumer prospects in SSA.
However, the reality is that a cautionary consumer mindset has led to more risk averse spending behaviour and a heightened focus on saving, especially in the areas of out of home eating, entertainment and fashion, followed by an acute awareness of price for consumer packaged goods. To counter this businesses have been drawn into more promotional activities, eroding brand equity and margins.
Kenya relinquishes top position due to fading macro-economic indicators and a declining business outlook amidst an unsettling election period. Economic growth slowed to 4.7% in the first quarter of 2017 brought about by drought and the credit slowdown. Rapidly rising inflation has driven food prices to five-year highs, which has plagued consumers and retail trading conditions. Consumers are less confident about their personal finances; their spare cash is limited, and their mindset remains cautionary with them opting to save rather than spend.
A continued missed opportunity
Cote d’Ivoire once again leads the APi overall ranking with strong macro-economic and retail prospects, but the country is dealing with deteriorating political stability and declining cocoa prices, which could lead to an economic deficit and pressure on household income, amplifying the already weaker consumer prospects.
Despite the country displaying strong indicators for growth, consumer prospects remain low. This is in part due to product fulfilment issues, with manufacturers failing to meet Ivorian consumers’ needs as they relate to a range of factors including: convenience, tradition, taste, ease of use, portability, scarcity and accessibility.
Cameroon comes into focus
Cameroon has risen to fourth position, is its highest rank to date. With a diversified natural resource base, rapid urbanisation and GDP per capita on par with Kenya, and higher than Uganda and Ethiopia, it is easy to understand its stronger consumer and retail prospects.
These are, however, offset by weaker macro-economic and business prospects. The economy is vulnerable to external impacts due to a reliance on commodities, and this, coupled with low investment in critical infrastructure, frequent power outages, and weak governance, has resulted in elevated costs of doing business. Cameroon has also been identified as one of the most challenging countries in the world to start a new business, limiting potential investors and preventing the economy from growing at its full potential.
Ghanaian Optimism
Ghana maintains fifth position on the APi, but this masks some of the ongoing improvement in the macro-economic, consumer and retail dynamics. It has also been rated as the best business prospect for successive periods. Economic advances in 2017, with growth rising to 6.6%, is spurred on by progress in the oil and non-oil sectors. Food inflation continues to decelerate easing the pressure on consumer wallets, resulting in an increasing number of Ghanaians spending more in store, more willing to try new things and positively influencing the previously weaker retail outlook.
Overall, the APi report shows that Africa continues to offer one of the greatest gifts of untapped growth, but requires bold strategies. Those invested or investing in Africa therefore need to reassess and implement in a more purposeful, precise and persistent manner in pursuit of consumer needs.
“Africa offers marketers one of the final destinations to develop and execute product, marketing and retail solutions from a clean slate perspective, which are differentiated, generate demand and deliver value yet there still seems to be a vacuum within these areas.
“On the plus side this points to significant potential for innovation and growth – what is required now is a steady investment by manufacturers and retailers into making these untapped opportunities work for them,” Wingfield further said.
With vast retail landscapes and widespread, diverse consumers it’s therefore all about precision over mass tactics in Africa coupled with exceptional product, marketing and retail innovation to capitalise on Africa’s prospects.
By Adedapo Adesanya
The Nigerian Upstream Petroleum Regulatory Commission (NUPRC) will, at the Commercial Bid Conference, announce the successful bidders for 50 oil and gas blocks in the 2025 Licensing Round on July 21, 2026.
The regulator said the conference would conclude an eight-month licence round that began on December 1, 2025, after President Bola Tinubu approved the exercise under the Petroleum Industry Act (PIA) 2021.
The commission said the 50 blocks include 15 onshore, 19 shallow-water, 15 frontier and one deep-offshore block, covering basins such as the Niger Delta, Chad Basin, Benue Trough, Anambra and Bida.
It said the round aims to attract about $10 billion in fresh investment and to unlock discovered but undeveloped fields, fallow assets and gas resources. NUPRC described the 2025 round as the third licensing exercise under the PIA framework and stressed it is designed to prioritise natural gas development.
NUPRC outlined a five-stage process for the round — registration and pre-qualification, data acquisition, technical bid submission and evaluation, and the commercial bid conference — followed by ministerial approval and contracting. The Commission said it notified pre-qualified applicants on March 16, 2026, and closed technical and commercial bids on June 12, 2026.
NUPRC chief executive, Mrs Oritsemeyiwa Eyesan, had said the selection would be merit-based and would exclude weaker applicants.
She said only candidates with strong technical and financial credentials, professionalism and credible development plans would advance, and that winners would be chosen on a weighted combination of technical and commercial scores.
To widen participation, the federal government fixed signature bonuses for the round in a prescribed range of $3 million to $7 million per block, the Commission said, adding that bids outside that range would be non-compliant and excluded.
NUPRC said it would resolve the tied highest bids within the range by conducting a sealed rebid for the signature bonus, adding that successful bidders will receive Petroleum Prospecting Licences (PPLs) and may elect either a Concession or a Production Sharing Contract (PSC) framework, noting that the choice of framework will determine fiscal terms for up to two decades.
The agency noted that bidders were required to present host community development plans and to commit to remit 3 per cent of operating expenditure to Host Community Development Trusts. It said decarbonisation objectives and broader environmental, social and governance (ESG) requirements were mandatory parts of submissions.
It warned that applicants with government debts, those that had previously failed to develop licences “vigorously and in a business-like manner,” or those found non-compliant with applicable laws could be disqualified at any stage.
The regulator said it expects ministerial approval and formal contracting between July and October 2026, after which awardees must execute concession contracts before licences take legal effect.
Recall that during the 25th Nigeria Oil and Gas (NOG) Energy Week in Abuja, the NUPRC issued PPLs to 12 companies across 19 blocks from the 2024 round. The Commission named recipients, including Boron Energy Limited, Energy Marketing and Supply Limited, Sahara Deepwater Resources Limited, Tulkan Energy E&P Company Limited and said that the exercise showed the licensing pipeline was functioning.
By Adedapo Adesanya
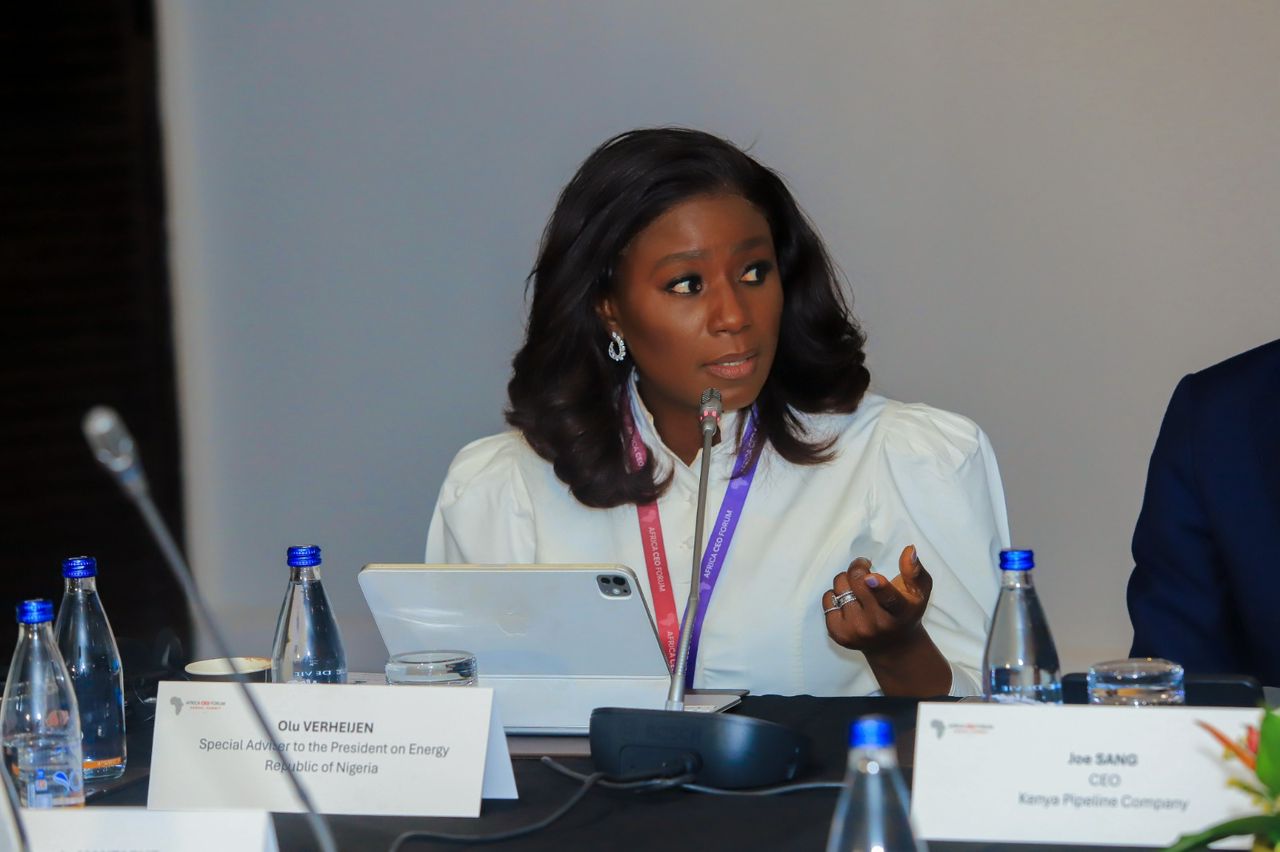
The Special Adviser to the President on Energy, Mrs Olu Verheijen, has said Nigeria requires about $38.3 billion in fresh investment to sustain current oil and gas production and achieve its 2030 output targets.
Speaking at the recently concluded 25th NOG Energy Week Conference and Exhibition in Abuja, Mrs Verheijen said global investors are now prioritising countries with predictable policies, competitive fiscal terms and credible regulatory systems.
“For Africa, that question is urgent. And for Nigeria, the scale of the task is equally clear: to sustain the current base and grow toward our 2030 production target, analysis shows a financing gap of about $38.3 billion,” she said.
According to her, the era when countries relied solely on resource endowment to attract capital has ended.
“Capital has no passport. It is rational. It prices risk. It follows credibility. It asks one question: can this country turn resources into bankable projects, and bankable projects into reliable returns?”
She said Nigeria had deliberately repositioned itself through reforms aimed at improving investor confidence and accelerating project execution.
“We recalibrated fiscal terms, clarified regulation and streamlined oversight. We introduced targeted incentives and cut contracting timelines by more than half. We made a clear statement to the world: Nigeria is no longer asking to be trusted; Nigeria is working to be bankable.”
Highlighting progress recorded under the reforms, Verheijen said Nigeria now has more than $50 billion worth of upstream projects in its visible investment pipeline.
“We now have more than 50 billion dollars of upstream projects in the visible pipeline. In the last three years, more than 10 billion dollars of long-awaited final investment decisions have come through.”
She added that crude oil and condensate production has increased by about 400,000 barrels per day since 2023, while onshore production is at its highest level in two decades.
“Crude oil and condensate production has risen by about 400,000 barrels per day since 2023. Onshore production is at its strongest level in twenty years.”
Mrs Verheijen said the Federal Government remains committed to achieving its target of producing three million barrels of oil per day and 10 billion standard cubic feet of gas daily by 2030, while strengthening Nigeria’s competitiveness in the global energy market.
She also highlighted ongoing reforms in the power sector, including the N4 trillion Presidential Power Sector Financial Reforms Programme, which she described as critical to restoring confidence across Nigeria’s electricity value chain.
On gas development, she said the government was expanding domestic LPG supply, improving affordability and supporting investments through tax and import duty incentives.
“A gas-rich nation cannot be comfortable when families are priced back to firewood, charcoal or kerosene,” she said.
Mrs Verheijen stressed that Nigeria’s ambition extends beyond exporting crude oil to building an industrial economy anchored on value addition.
“We have chosen not merely to produce molecules, but to convert molecules into megawatts, fertiliser, petrochemicals, mobility, manufacturing, jobs and exports.”
She concluded that the country’s reforms were laying the foundation for long-term growth despite lingering challenges.
“The age of Nigerian hesitation is ending. The age of Nigerian ambition has begun. Our task now is to turn reform into relief, capital into projects, projects into jobs, and energy into national greatness.”
By Adedapo Adesanya
Nigeria’s headline inflation rate in June 2026 moderated to 15.91 per cent from 15.93 per cent in May, as pressure from the Iran war mildly eased, though it largely remained in focus during the review month.
In the report on Wednesday, the statistical office showed that the headline inflation rate for June on a month-on-month basis was 1.66 per cent, 0.09 per cent lower than the 1.75 per cent recorded in May 2026.
On an annualised basis, the print was down from 25.29 per cent in the same month of the preceding year (June 2025). This was due to the rebasing of the calculation year from 2009 to 2024.
The rise in prices, which stemmed from the continued conflict in the Middle East, continued to stoke food prices and energy costs, which account for a huge chunk of average spending.
The food inflation rate in May 2026 on a month-on-month basis was 3.75 per cent, up by 0.77 percentage points from May 2026 (2.98 per cent), while on a year-on-year basis, it was 17.52 per cent and stood at 25.41 per cent in the same month of the preceding year (June 2025).
At 15.91 per cent print, the inflation marginally beat expectations by Meristem Research, predicted at 15.95 per cent.
There had been expectations that the ceasefire between the United States and Iran would help drive oil prices lower, raising expectations of some relief on the inflation front. However, with conflicts now flaring up again, oil prices are likely to increase again, and the anticipated easing in energy-driven inflation may not materialise as broadly as earlier envisaged.
Meristem Research said it expects inflationary pressures to re-emerge across key economies in the near term, as the re-escalation of the US-Iran conflict has reignited upward pressure on global oil prices.
This will be a core factor that the Monetary Policy Committee (MPC) of the Central Bank of Nigeria (CBN) will be looking at when it meets for the next policy meeting. At its last meeting, the committee left benchmarked interest rates at 26.5 per cent.
