
Economy
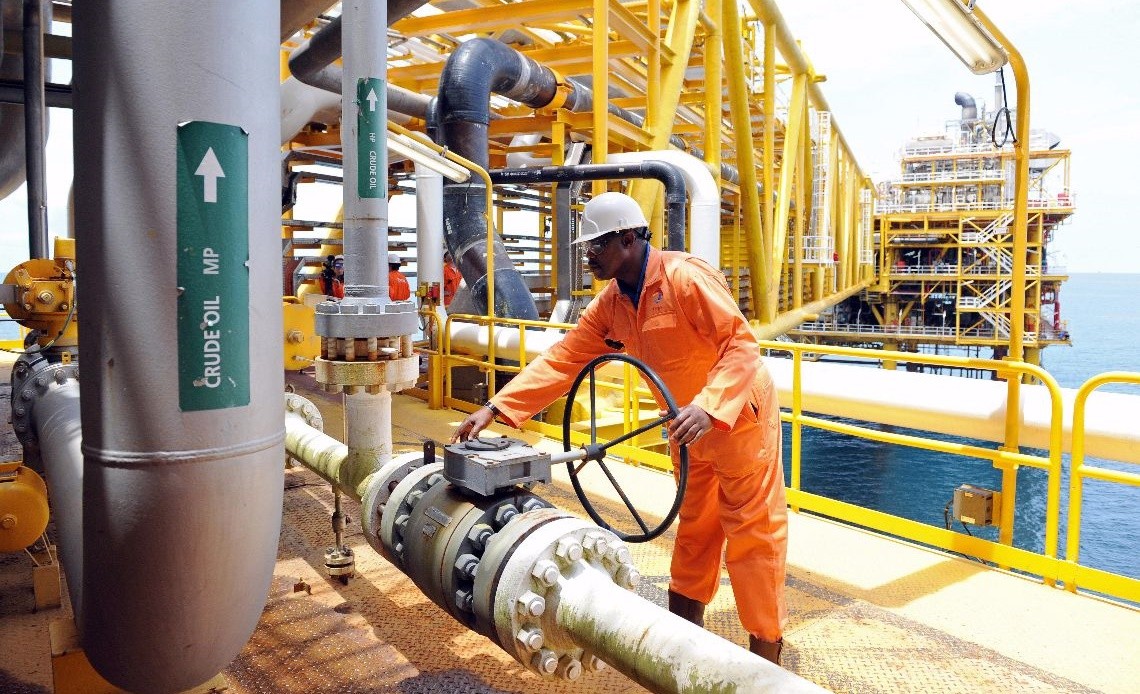
Nigeria Struggles to Meet OPEC Quota by 180,000bpd
By Adedapo Adesanya
For yet another month, Nigerian crude oil production fell in January 2022 as the country produced 1.5 million barrels per day, 180,000 barrels per day lower than what it is permitted to supply to the global market, though its production last month was the highest in five months.
Nigeria’s January output marked a recovery from the fourth quarter of last year when production was hit by a number of sabotage incidents and infrastructure issues.
The Organisation of the Petroleum Exporting Countries (OPEC), which Nigeria is a member, saw its crude production increase again last month but the group fell further short of its target amid dwindling spare capacity.
Under the OPEC quota, Nigeria is expected to produce 1.68 million barrels per day level.
Alongside its allies known collectively as OPEC+ raised output by 260,000 barrels per day to 37.94 million barrels per day in January.
This is 800,000 below the target for the month, according to a survey by Argus.
The group is finding it increasingly difficult to keep pace with its monthly 400,000 barrels per day hike in quotas as spare capacity tightens.
Argus estimates that the coalition’s spare capacity could drop as low as 3.8million barrels per day by the end of March.
OPEC members accounted for much of last month’s increase, with Mideast Gulf producers delivering some of the largest hikes. Saudi Arabia and the United Arab Emirates (UAE) — which hold most of the group’s remaining spare capacity — raised production by 100,000 barrels per day and 60,000 barrels per day respectively.
Russia and Oman were the only non-OPEC members of the group that managed to raise production last month.
Russia, which is fast running out of spare capacity, delivered a 90,000 barrels per day increase to take its output above 10 million barrels per day for the first time since April 2020, but it was still short of its January quota.
Several of the group’s large producers saw their production decline last month, including Iraq, where crude exports were constrained by adverse weather, and Kazakhstan, where protests briefly interrupted operations at the Tengiz field.
Of the three OPEC countries that are exempt from quotas, Iran was the only one to increase output in January. Firmer exports pushed Iranian production 30,000 barrels per day higher.
Talks to revive the 2015 nuclear deal and remove US sanctions on Iranian oil exports restarted this month.
After three months of consecutive gains, Venezuelan output dropped by 60,000 barrels per day in January. Venezuela has been importing Iranian condensate to dilute and upgrade extra-heavy crude from the Orinoco belt into an exportable heavy sour grade in recent months, but analysts note that the latest shipment was delayed, Argus noted.
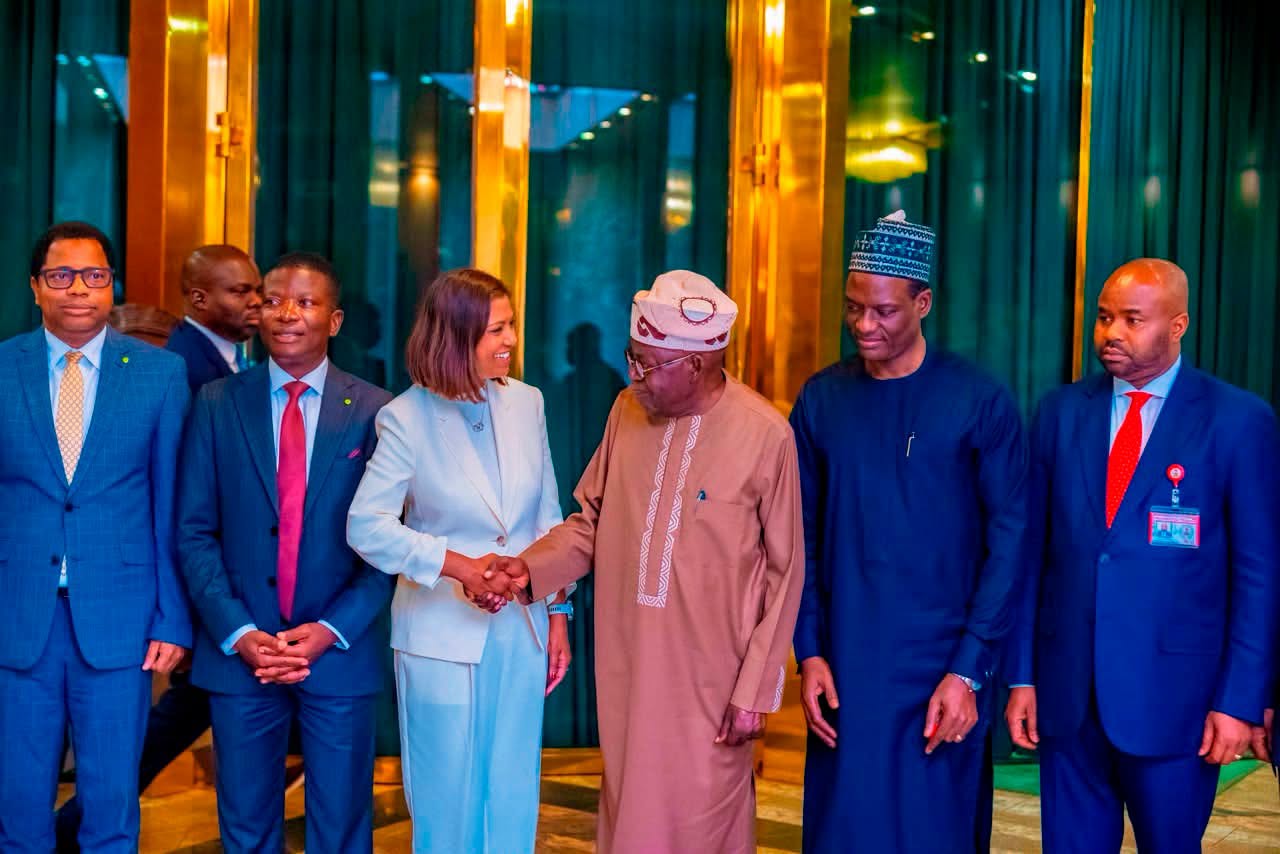
**Tinubu Says Economy on Steady Growth
By Modupe Gbadeyanka
President Bola Tinubu has been praised for the ongoing financial and fiscal reforms in the country and encouraged to pursue a stronger partnership that supports investments, youth training, and employment.
The chief executive of Deloitte Africa, Ms Ruwayda Redfearn, who led a delegation to visit Mr Tinubu in Abuja on Wednesday, said the global organisation is primarily focused on digital and business transformation, with over 500,000 employees worldwide working across various roles and locations, including over 6,000 in Africa, adding that her accountancy firm’s revenue was $74 billion in 2025.
“We are here before you to say that we want to serve. We have a local team on the ground that is ready, as well as the global firm, to support you and support your administration as you lead the country,” she said.
Also, the chief executive of Deloitte West Africa, Mr Yomi Olugbenro, assured President Tinubu of the firm’s support for the reforms.
“We do what we do because of the philosophy that our African CEOs talk about – making an impact that matters. Where we are at the moment, we believe that the ground has been solidly laid. There is a need to truly extract more value and deliver the dividends of democracy to ordinary Nigerians on the street. The bigger work is really about how to cascade some of those big reforms further down.
“We do believe that with the capabilities that the firm has all over the world, with the half a million people that our CEO spoke about, we have use cases, examples, and experiences of how we supported nations all around the world, so Nigeria will definitely benefit from those experiences.
“So, that is why we are here, and we welcome the invitation that you may grant us as to where exactly you want us to support you,” he stated.
In his remarks, Mr Tinubu informed his guests that his administration’s reforms have steadily stabilised the economy over three years, with growing plaudits for positive development and growth indicators.
“We are following the example of Deloitte’s greatness to change things from the foundation, building the necessary future for our people.
“Yes, reforms are difficult. It has not been a McDonald’s customer relationship but a harvester of good things, if implemented well, and that is what we are about.
“Thank you for your partnership in paying attention to what we are doing here, as we have heard from the Minister of Finance about the fiscal, revenue and tax reforms that have taken place and are moving the nation forward.
“The reforms on revenue will continue to stimulate growth. And the effect of the reform? Yes, some issues are difficult to take the bitter medicine, but it is working well. For the economy, Nigeria is making serious foundational progress,” he stated.
The President said the reforms had stimulated the economy, strengthened the fiscal and revenue sectors, repositioned financial institutions, and prepared the country to be more globally relevant and competitive, urging Deloitte Africa to improve its impact on the Nigerian economy by training and recruiting the dynamic youth population.
“The family of Deloitte; you just reminded me of my cradle years in accountancy and where I cut my childhood accounting teeth in Chicago. Deloitte has a good training programme, and I believe you will continue to reflect that,” he added.
By Adedapo Adesanya
Oil prices fell on Wednesday after the United States’ attacks against Iranian military installations that aimed to limit its ability to strike shipping in the Strait of Hormuz.
Brent futures declined by $1.11 or 1.31 per cent to $83.62 a barrel, while the US West Texas Intermediate (WTI) futures lost 81 cents or 1.02 per cent to close at $78.53 a barrel.
Attacks worsened a supply disruption in the Strait of Hormuz, through which about a fifth of the world’s oil and liquefied natural gas passed prior to the war’s outbreak.
The US military said it had hit dozens of military targets near the strategic waterway and Iranian coastal areas in strikes lasting seven hours. In response, Iran’s Islamic Revolutionary Guard Corps (IRGC) said on Wednesday it had struck American military targets in the region, including in Bahrain, Kuwait and Jordan.
The US military said its fresh strikes on Wednesday against Iran’s coastal defence systems and cruise missile storage and launch sites were “designed to further degrade military capabilities Iranian forces have used to attack commercial shipping in the Strait of Hormuz.”
The US alleged that said Iran had “intentionally” targeted civilians and attacked seven commercial vessels over the previous week, leaving roughly a dozen crew members dead, missing or injured.
The hostilities between Iran and the US reignited last week, breaking an already fragile truce reached in June after several months of fighting. The collapsed ceasefire precipitated a new crisis in the waterway, and Iran threatened to close all other export corridors that benefit the US and its allies.
The US Energy Information Administration reported a 1.7 million-barrel drop in US crude inventory last week. The American Petroleum Institute (API) had estimated that crude oil inventories in the US fell by 564,000 barrels in the week ending July 10.
Goldman Sachs estimated in a note that Gulf exports recovered to more than 80 per cent of pre-war levels after the US-Iran memorandum of understanding in June but slipped back below 50 per cent, or about 11 million barrels per day, over the last week.
The bank said Brent could exceed $110 in the fourth quarter this year if the Gulf export recovery continues to stall.
By Adedapo Adesanya
The Nigerian Upstream Petroleum Regulatory Commission (NUPRC) will, at the Commercial Bid Conference, announce the successful bidders for 50 oil and gas blocks in the 2025 Licensing Round on July 21, 2026.
The regulator said the conference would conclude an eight-month licence round that began on December 1, 2025, after President Bola Tinubu approved the exercise under the Petroleum Industry Act (PIA) 2021.
The commission said the 50 blocks include 15 onshore, 19 shallow-water, 15 frontier and one deep-offshore block, covering basins such as the Niger Delta, Chad Basin, Benue Trough, Anambra and Bida.
It said the round aims to attract about $10 billion in fresh investment and to unlock discovered but undeveloped fields, fallow assets and gas resources. NUPRC described the 2025 round as the third licensing exercise under the PIA framework and stressed it is designed to prioritise natural gas development.
NUPRC outlined a five-stage process for the round — registration and pre-qualification, data acquisition, technical bid submission and evaluation, and the commercial bid conference — followed by ministerial approval and contracting. The Commission said it notified pre-qualified applicants on March 16, 2026, and closed technical and commercial bids on June 12, 2026.
NUPRC chief executive, Mrs Oritsemeyiwa Eyesan, had said the selection would be merit-based and would exclude weaker applicants.
She said only candidates with strong technical and financial credentials, professionalism and credible development plans would advance, and that winners would be chosen on a weighted combination of technical and commercial scores.
To widen participation, the federal government fixed signature bonuses for the round in a prescribed range of $3 million to $7 million per block, the Commission said, adding that bids outside that range would be non-compliant and excluded.
NUPRC said it would resolve the tied highest bids within the range by conducting a sealed rebid for the signature bonus, adding that successful bidders will receive Petroleum Prospecting Licences (PPLs) and may elect either a Concession or a Production Sharing Contract (PSC) framework, noting that the choice of framework will determine fiscal terms for up to two decades.
The agency noted that bidders were required to present host community development plans and to commit to remit 3 per cent of operating expenditure to Host Community Development Trusts. It said decarbonisation objectives and broader environmental, social and governance (ESG) requirements were mandatory parts of submissions.
It warned that applicants with government debts, those that had previously failed to develop licences “vigorously and in a business-like manner,” or those found non-compliant with applicable laws could be disqualified at any stage.
The regulator said it expects ministerial approval and formal contracting between July and October 2026, after which awardees must execute concession contracts before licences take legal effect.
Recall that during the 25th Nigeria Oil and Gas (NOG) Energy Week in Abuja, the NUPRC issued PPLs to 12 companies across 19 blocks from the 2024 round. The Commission named recipients, including Boron Energy Limited, Energy Marketing and Supply Limited, Sahara Deepwater Resources Limited, Tulkan Energy E&P Company Limited and said that the exercise showed the licensing pipeline was functioning.
